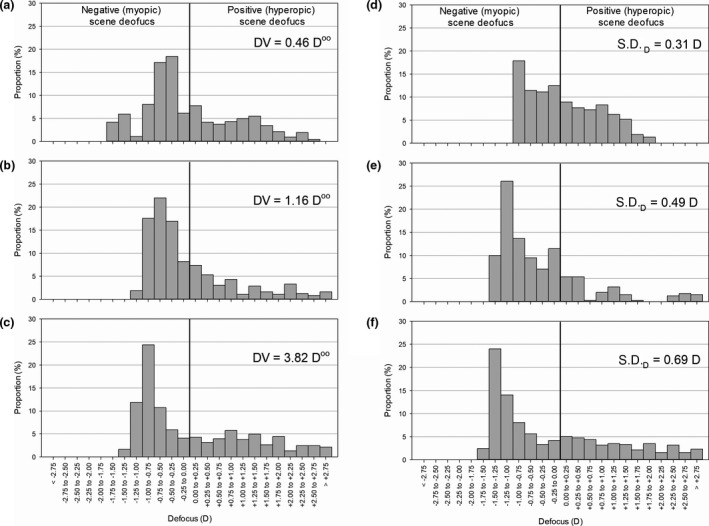
Figure 4.

Scene defocus distribution of central 30° from representative subjects – Subject a: The 1st quartile of dioptric volume (DV); Subject b: The 2nd quartile of DV; Subject c: The 3rd quartile of DV; Subject d: The 1st quartile of standard deviation of the scene defocus (SDD); Subject e: The 2nd quartile of SDD; Subject f: The 3rd quartile of SDD. The DV represented the total amount of net defocus, while the SDD represented the dispersion of scene defocus value within the central 30°.
