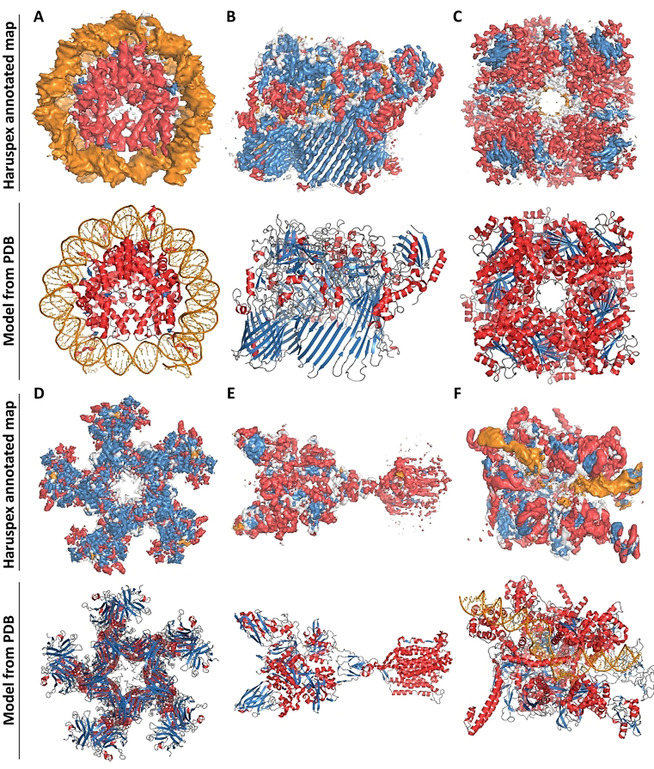
Figure 3.

Additional examples from the test set. Top: Annotated map. Bottom: Deposited structure for comparison. Orange corresponds to RNA/DNA; red to helices; blue to sheets and grey regions were not assigned any secondary structure. A) Nucleosome from Xenopus laevis, average map resolution 3.8 Å (map: EMDB 4297, model: PDB 6FQ5): recall 98.5 %, precision 94.0 %. B) Flavobacterium johnsoniae Type 9 protein translocon, average map resolution 3.5 Å (map: EMDB 0133, model: PDB 6H3I): recall 96.3 %, precision 49.3 %. C) Leucine dehydrogenase from Geobacillus stearothermophilus, average map resolution 3.0 Å (map: EMDB 9590, model: PDB 6ACF): recall 89.8 %, precision 85.7 %. D) Escherichia coli Type VI secretion system, average map resolution 4.0 Å (map: EMDB 9747, model:PDB 6IXH): recall 95.9 %, precision 70.9 %. E) Homo sapiens metabotropic glutamate receptor 5, average map resolution 4.0 Å (map: EMDB 0345, model: PDB 6N51): recall 95.9 %, precision 71.7 %. F) Bacterial RNA polymerase‐sigma54 holoenzyme transcription open complex, average map resolution 3.4 Å (map: EMDB 0001, model: PDB 6GH5): recall 94.2 %, precision 67.5 %.
