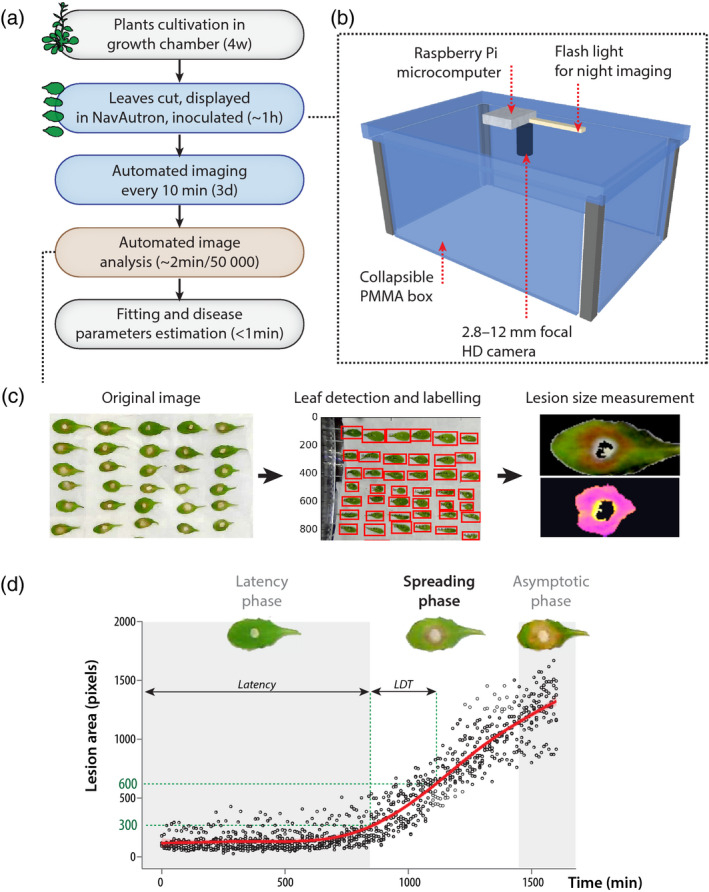
Figure 1.

Analysis of quantitative disease resistance (QDR) against Sclerotinia sclerotiorum with the Navautron system.
(a) Pipeline describing the experiments reported in this manuscript. Detached leaves were analyzed with the Navautron through automated imaging, automated image analysis, curve fitting, and QDR parameters estimation. Approximate duration for each step is indicated (d, days; w, weeks).
(b) The Navautron setup: Each Navautron consists of a transparent plastic box (poly(methyl‐methacrylate), PMMA) equipped with a Raspberry Pi microcomputer, a high‐definition (HD) camera and a LED flash light.
(c) The three major steps of the automated image analysis.
(d) Typical kinetics of S. sclerotiorum disease lesion development on A. thaliana, illustrating the latency phase, spreading phase, and asymptotic phase. Characteristic values are the duration of latency phase and the lesion doubling time (LDT). Data shown correspond to values collected on five leaves of A. thaliana Col‐0, the red curve shows fitted average.
