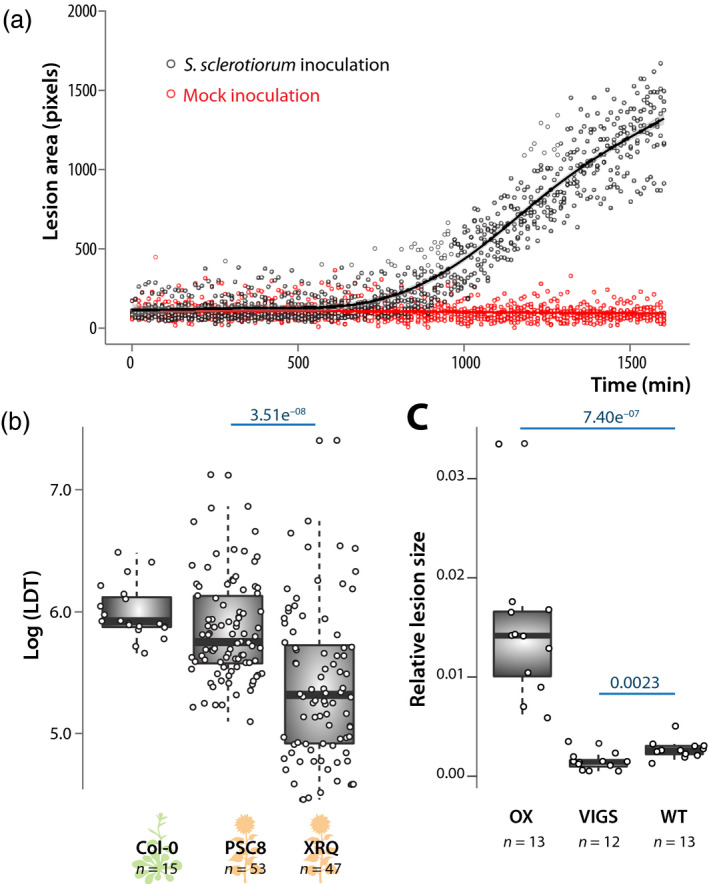
Figure 2.

Assessment of sensitivity and versatility of the Navautron system for quantifying plant disease symptoms.
(a) Kinetics of disease lesion development of leaves inoculated by S. sclerotiorum (black) and mock inoculated (sterile agar plug, red). Data shown correspond to values collected on five leaves of A. thaliana Col‐0, lines show fitted average.
(b) Lesion doubling time (LDT) measured on leaves of A. thaliana Col‐0 accession and sunflower PSC8 and XRQ genotypes after inoculation by Sclerotinia sclerotiorum. LDT was measured on n = 15 to 53 mature leaves per genotype in three independent biological replicates. Statistical difference between LDT on the two sunflower genotypes was assessed by Student’s t‐test with P‐value indicated in blue.
(c) Relative size of necrotic lesions measured on leaves of Nicotiana benthamiana plants overexpressing the REM1.3 remorin protein (OX), silenced for rem1.3 by virus‐induced gene silencing (VIGS), and wild‐type (WT), after inoculation by Phytophthora infestans. Measurements were performed on 12 or 13 infection sites per genotype. Statistical difference between LDT was assessed using a Wilcoxon’s test with P‐value indicated in blue. Boxplots show 1st and 3rd quartiles (box), median (thick line) and the most dispersed values within 1.5 times the interquartile range (whiskers).
