Figure 3.

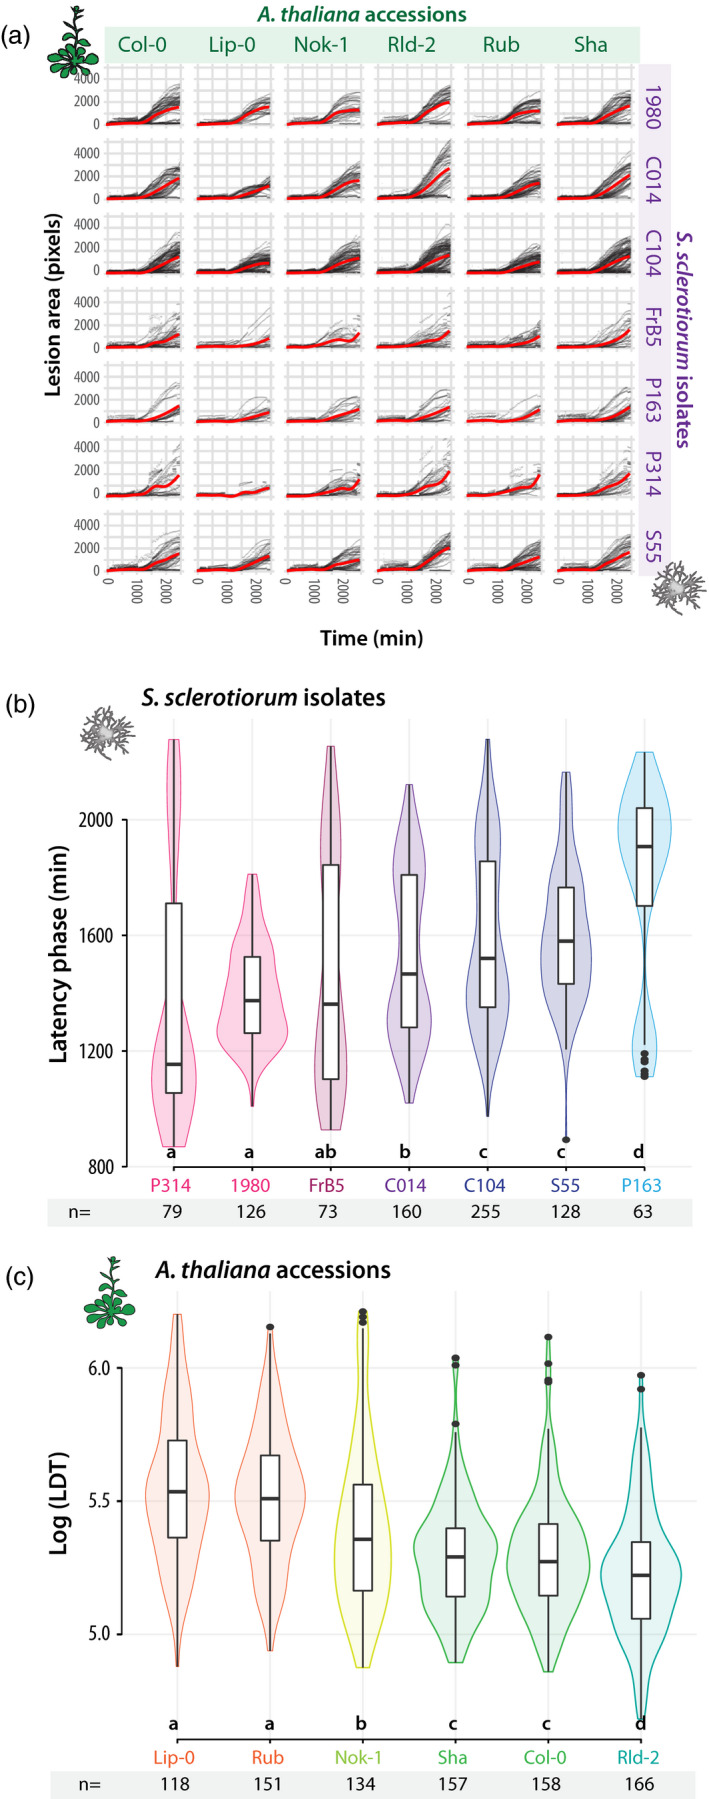
Characteristic values describing disease symptom dynamics in the interaction between seven Sclerotinia sclerotiorum isolates and six A. thaliana accessions.
(a) Kinetics of disease lesion development for 42 different combinations of A. thaliana natural accessions (columns) and S. sclerotiorum isolates (lines). Red curves show smooth fitting curves for 1500 to 12 250 measurements.
(b) The duration of latency phase (Y‐axis) was mostly dependent on S. sclerotiorum isolates (x‐axis), ranked from the most (P314) to the least virulent (P163). Duration of the latency phase was measured n = 63 to 255 times for each isolate.
(c) The lesion doubling time (LDT, y‐axis) was mostly dependent on A. thaliana accessions (y‐axis), ranked from the most (Lip‐0) to the least resistant (Rld‐2). LDT was measured n = 118 to 158 times on each accession. Letters and colours indicate groups of significance determined by post hoc pairwise t‐tests. Boxplots show 1st and 3rd quartiles (box), median (thick line) and the most dispersed values within 1.5 times the interquartile range (whiskers).
