Figure 5.

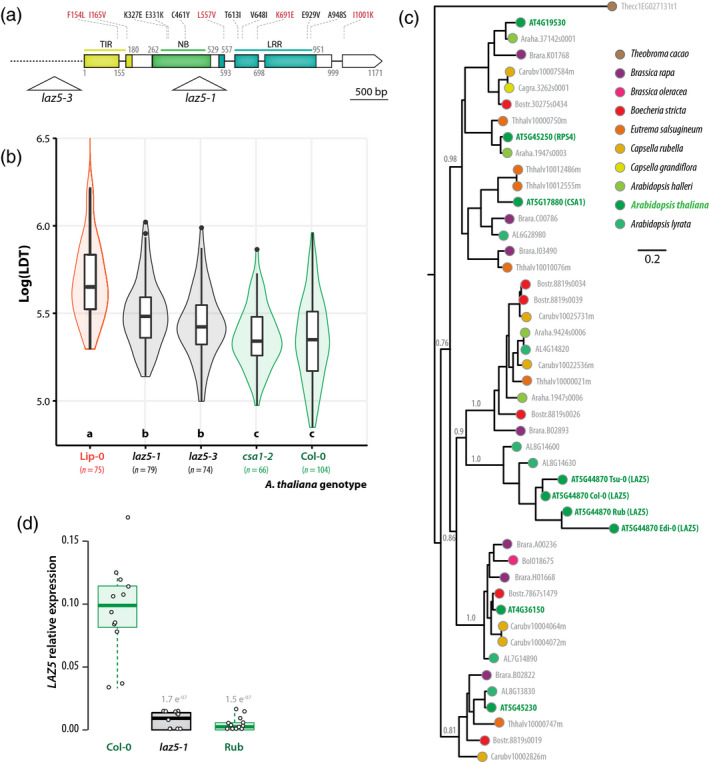
Disruption of the NLR gene LAZ5 reduces lesion doubling time upon Sclerotinia sclerotiorum challenge.
(a) Schematic map of the LAZ5 gene showing the position of T‐DNA insertion in the laz5‐1 and laz5‐3 mutant lines (triangles). Exons are shown as boxes, introns as plain lines, upstream non‐coding region as a dotted line. Domains encoded by exons are colour coded and labelled TIR, NB, and LRR. Positions are given as amino acid numbers. Non‐synonymous mutations known in Lip‐0 allele are indicated above boxes, in red when present in (Atwell et al., 2010), in black otherwise.
(b) Lesion doubling time (LDT, Y‐axis) in the most resistant accession Lip‐0, two laz5 mutant lines, the csa1‐2 mutant, and Col‐0 wild‐type. LDT was measured n = 74 to 104 times on each accession. Letters and colours indicate groups of significance determined by post hoc pairwise t‐tests.
(c) Phylogenetic relationship of LAZ5 and its 42 closest homologues in the phytozome 12.1 database. LAZ5 closest homologue outside of the Brassicaceae family (Theobroma cacao 1EG027131) was included as outgroup, and alleles from A. thaliana Edi‐0, Rub, and Tsu‐0 natural accessions to represent infraspecific diversity. The tree obtained by a maximum likelihood analysis is shown, with the number of substitution per site used as branch length, and branch support determined by an approximate likelihood‐ratio test (grey labels). Terminal nodes are colour coded according to plant species.
(d) Relative expression of the LAZ5 gene determined by quantitative RT‐PCR in healthy plants. Values shown correspond to three independent biological samples analyzed through four technical repeats each. Statistical difference from expression in Col‐0 plants was assessed with Student’s t‐tests. Boxplots show 1st and 3rd quartiles (box), median (thick line) and the most dispersed values within 1.5 times the interquartile range (whiskers).
