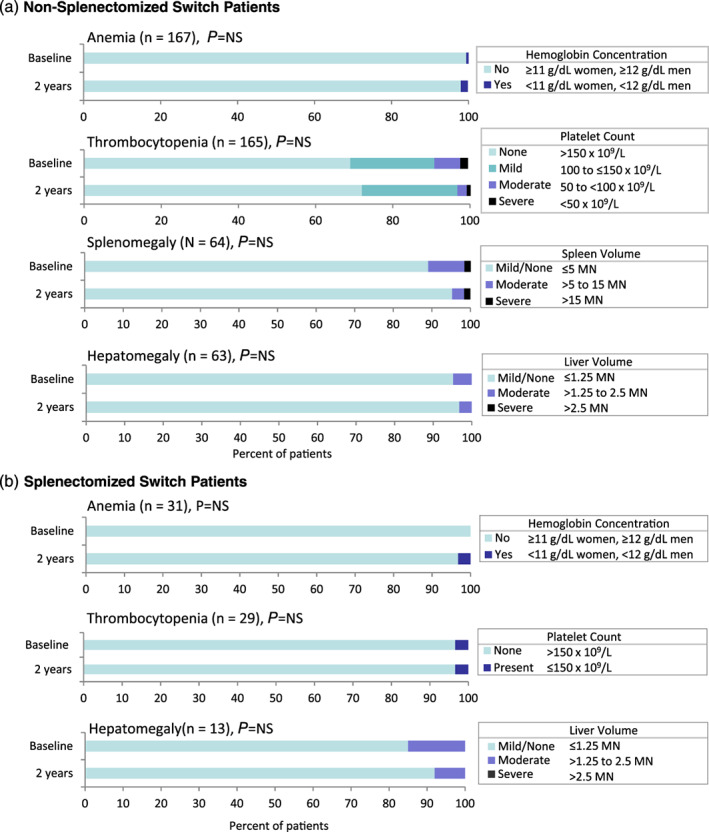
FIGURE 3.

Proportion of switch patients with anemia, thrombocytopenia, splenomegaly, and hepatomegaly at baseline and after 2 years of eliglustat therapy. The P values are from Wilcoxon signed‐rank tests comparing 2‐year parameters to baseline, except where McNemarʼs test was used for anemia (non‐splenectomized and splenectomized switch patients) and thrombocytopenia in splenectomized switch patients. MN, multiples of normal organ size; NS, not significant
