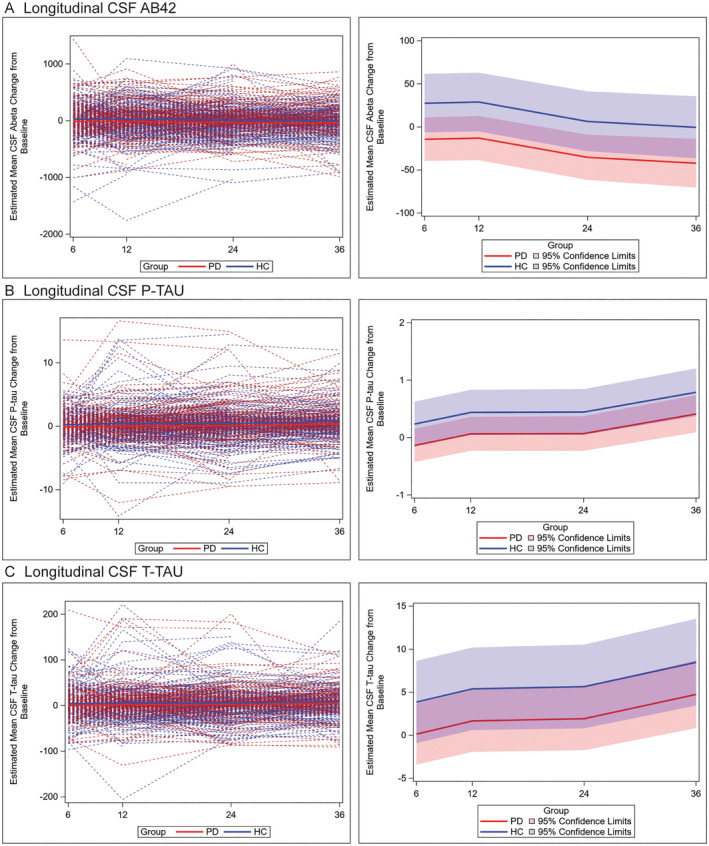
FIGURE 3.

Individual patient data for median change in AD CSF biomarker measurements at each timepoint. Spaghetti plot depicts individual‐patient trajectories (left panels) and trend lines (right panels) depict mean values for PD (red) and HC (blue) and 95% CI for mean change in biomarker value at each time point using LMM adjusted for age, sex, and the baseline value of the CSF outcome for mean change in measurements for CSF Aβ42 (A) t‐tau (B) and p‐tau (C) at 6, 12, 24, and 36‐month timepoints. Across all timepoints we found a greater reduction in CSF Aβ42 (mean difference −41.83 pg/mL; SE = 18.94; p = 0.03) and p‐tau (mean difference = −0.38 pg/mL; SE = 0.22; p = 0.03), in patients with PD compared to HCs with a nonsignificant trend for CSF t‐tau (mean difference = −3.7 pg/mL; SE = 2.7; p = 0.07).
