
FIGURE 2.
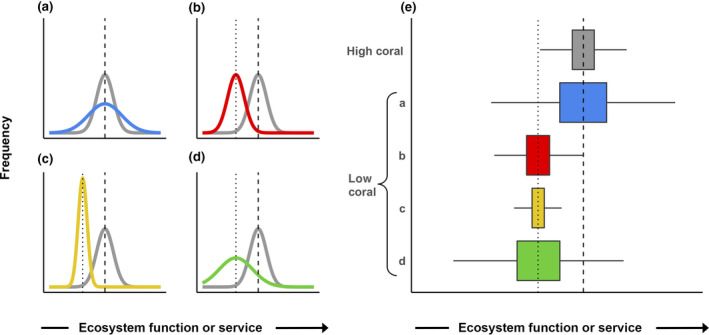
A priori hypotheses about different ecosystem patterns observed on high and low coral cover reefs. (a)–(d) Shifted distributions relative to a high‐coral state (gray). At low coral cover, relative values may have equal mean and increased variance (a; blue), decreased mean and equal variance (b; red), decreased mean and decreased variance (c; yellow), or decreased mean and increased variance (d; green). (e) Distributions from (a) to (d) as boxplots. These alternative hypotheses are not a complete set, as some services could also potentially increase with declining coral cover. Furthermore, we represent hypotheses based on comparisons of high and low coral cover for simplicity, although our empirical analyses focused on three coral cover categories to better capture variation in coral cover across the Caribbean