
FIGURE 3.
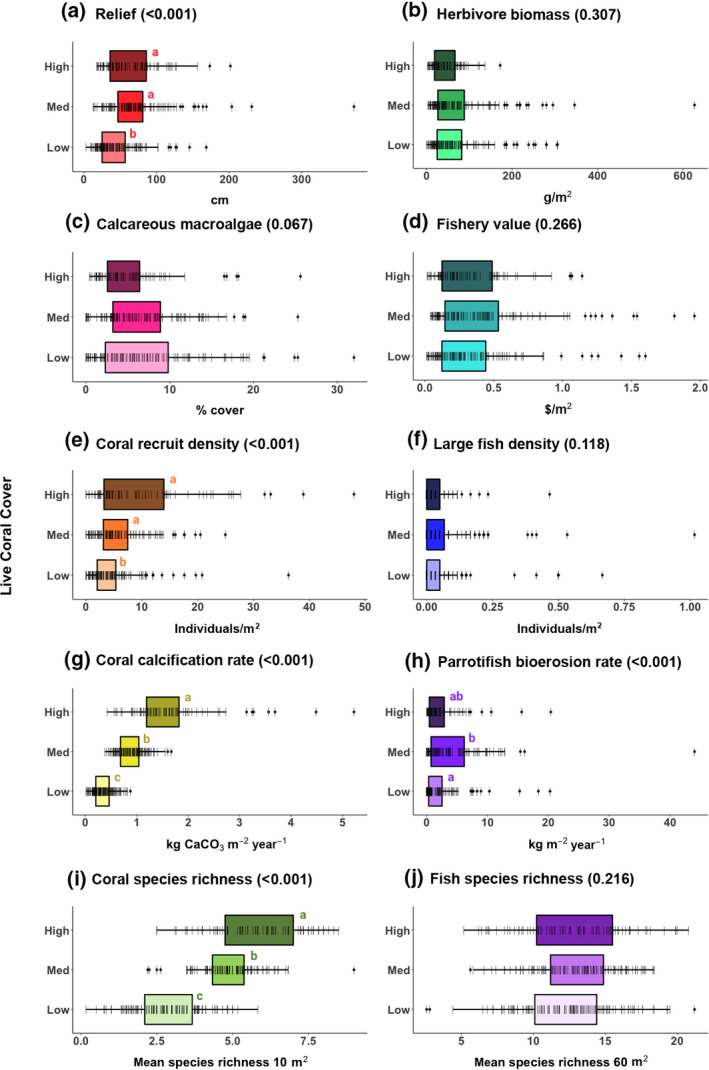
Distribution of 10 metrics, by three categories of mean percent live coral cover. High coral cover is defined as >20%, medium is 10%–20%, and low is <10%. Data from AGRRA (2018; number of sites for high, medium, low coral cover: a–g, i, j, n = 79, 120, 129; h, n = 65, 104, 103). Lines represent individual data points. P‐value from linear mixed effects model results (Table 2) shown in parentheses after panel title, with results of Tukey's post hoc test shown by letters next to boxes (coral categories sharing a letter are not significantly different from one another)