
FIGURE 4.
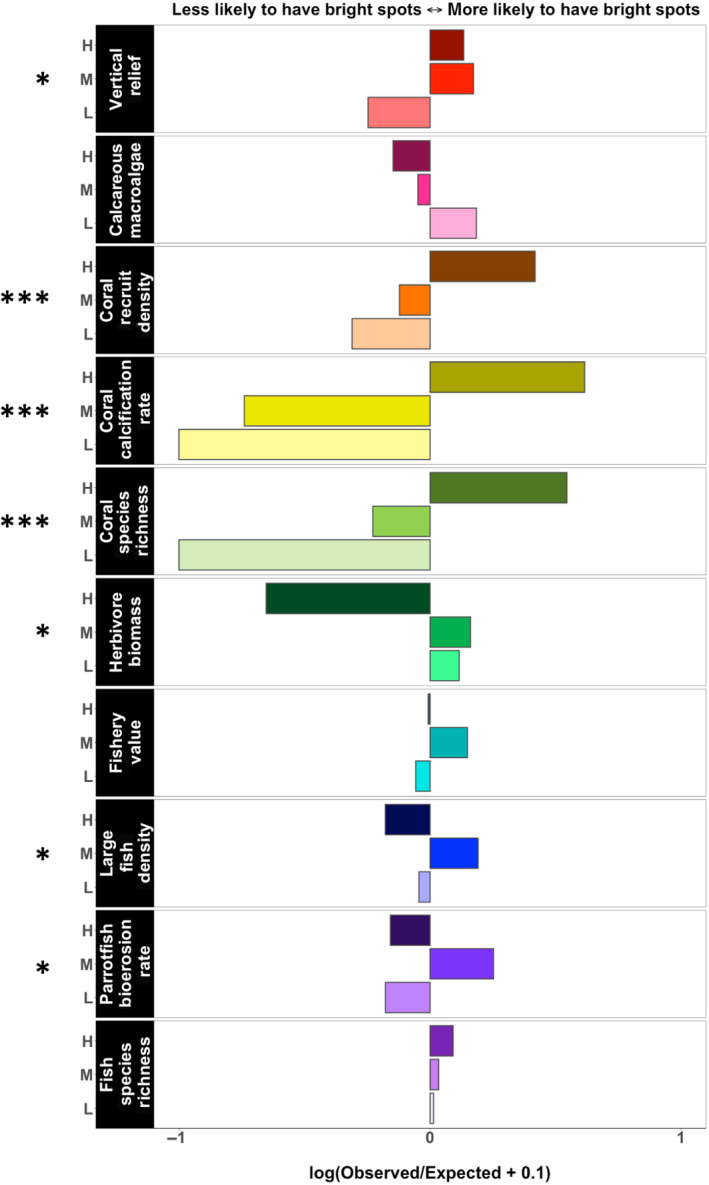
Log of observed by expected site count ratios for the sites in the 90th percentile for each metric. Values of this ratio greater than zero indicate that “bright spots” were more likely to occur in a coral category than expected by chance alone, and vice versa. H, M, L indicates high, medium, and low coral cover sites. Expected site counts are from chi‐squared tests, with the stars at the left showing the significance thresholds for these chi‐squared tests (see Table 2). To account for the two instances where the expected count was zero, we used log (ratio + 0.1) for all metrics