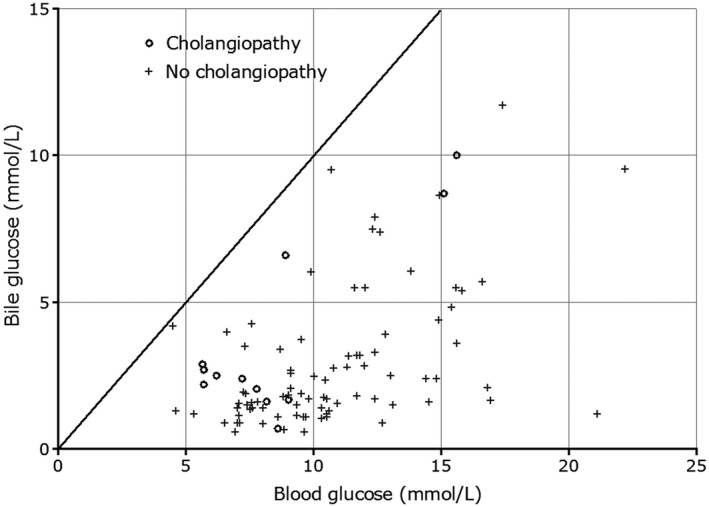
Fig. 1.

A graph illustrating the relationship of glucose concentration in the bile and blood after reperfusion of the liver in the recipients. The straight line indicates where bile and blood glucose are the same. We would expect all readings to lie below the line. Patients with cholangiopathy (indicated by the circles) had less difference between biliary and blood glucose, but there were patients without cholangiopathy whose values were on or near the line of equivalence. The graph also illustrates the saturation of the glucose transporter, where the bile glucose starts at a higher blood glucose concentration.
