. 2020 Mar 25;20(8):1472–1492. doi: 10.1039/c9lc01047e

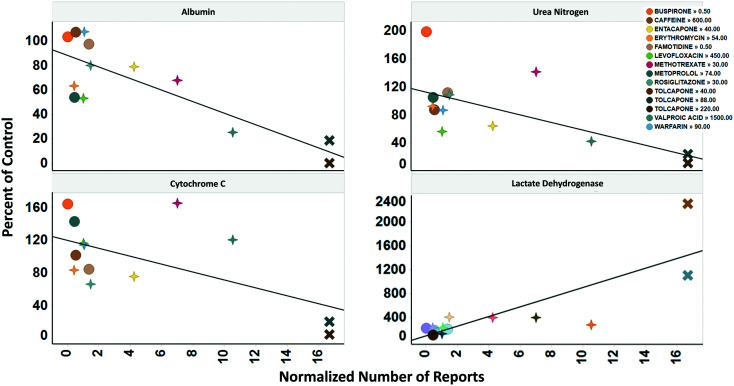
Fig. 7. Concordance of in vitro measurements with clinical observations. The four assays shown were chosen based on reproducibility assessment of 12 compounds tested for liver toxicity in the human MPS experimental liver model. The effect of the compounds on the secretion of albumin and urea nitrogen, translocation of the cytochrome C biomarker from the mitochondria, and leakage of lactate dehydrogenase to the medium is expressed as percent of the vehicle control and plotted against the total number of normalized number of reports for increased alanine aminotransferase and aspartate aminotransferase, and abnormal liver function test downloaded from the adverse events page (see Fig. S4) in the MPS-Db. The correlation coefficients (r2) for albumin = 0.68, urea nitrogen = 0.44, cytochrome C = 0.37, and LDH = 0.67. Albumin, urea nitrogen, and cytochrome C were measured after 5 days of treatment. LDH values are the peak values obtained during the time course. The color legend shows the compound treatment and concentration (in μM except for methotrexate which is in nM) tested. The shapes denote the clinical toxicity risk assessment: circle is low risk, cross is a Dili risk, and “X” is high risk. Note that for LDH there is a concentration dependent response for tolcapone.

Fig. 7