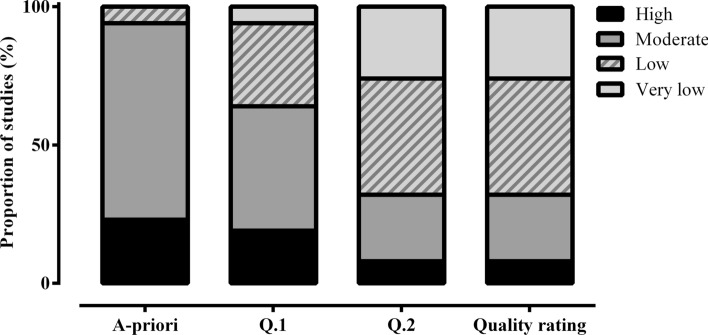
Fig. 3.
Quality rating of outcomes from all included studies (n = 78). Each bar represents the proportion of studies assigned a “high,” “moderate,” “low,” or “very low” quality rating. The x-axis represents the different stages of the quality appraisal process, with question one (Q. 1) and question two (Q. 2) indicating the questions asked to determine menstrual cycle phase identification and verification in each study, with the final bar representing the proportion of studies assigned to each quality rating category

