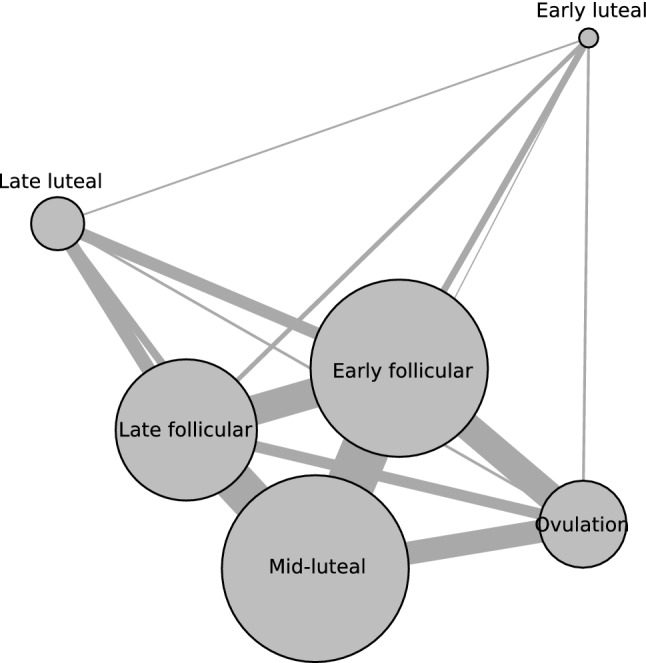
Fig. 5.

Network diagram illustrating the pairwise effect sizes calculated across the six menstrual cycle phases (early follicular, late follicular, ovulation, early luteal, mid-luteal and late luteal). The analysis included direct and indirect pairwise effect sizes from 73 studies. The relative size of nodes and relative thickness of connecting lines illustrate the frequency of outcomes measured in a given menstrual cycle phase and the number of direct comparisons between two phases, respectively
