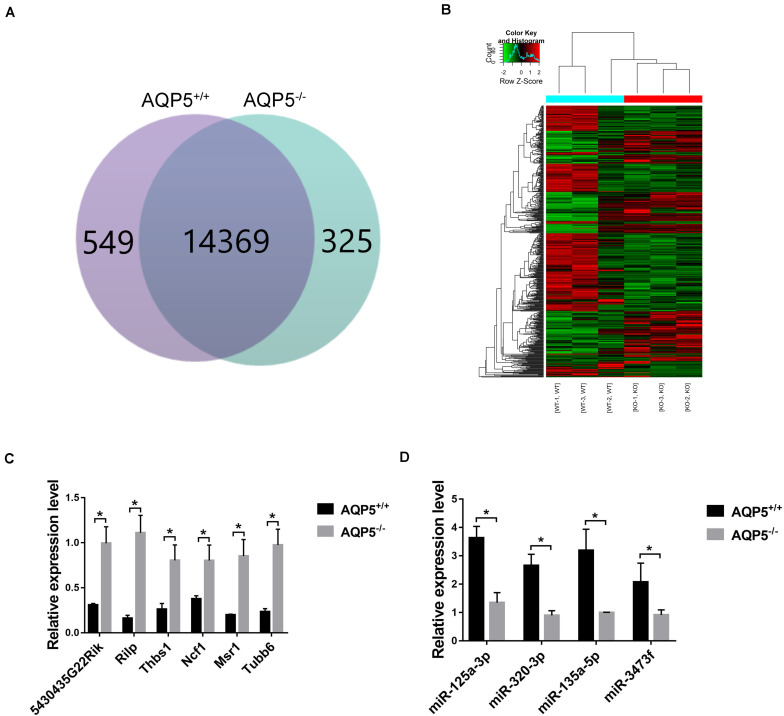
FIGURE 6.
Identification of differential expression of mRNA after AQP5 knockout. (A) Venn diagram of differentially expressed mRNA; 15,243 mRNAs were detected in both mice. (B) Clustering graph. Hierarchical clustering displayed the mRNA expression profile of the AQP5–/– mice (n = 3) vs. the AQP5+/+ mice (n = 3). (C) The expression of six upregulated mRNAs in AQP5+/+ and AQP5+/+ mice was detected by real-time fluorescence quantitative PCR. (D) The expression of four downregulated miRNAs in AQP5+/+ and AQP5+/+ mice was detected by real-time fluorescence quantitative PCR. *p < 0.05.

