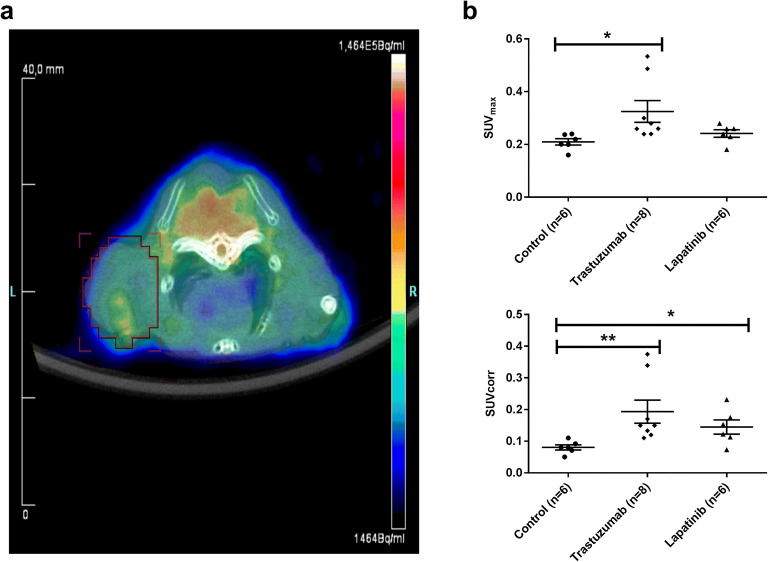
Fig. 2.
a Representative [18F]FES-PET-CT fusion image of a mouse bearing a SKOV3 xenograft treated with trastuzumab. The tumor is delineated by the red region of interest. Quantitative 18F-FES uptake (b) as SUVmax and (c) as SUVcorr in SKOV3 xenografts of mice treated with trastuzumab, lapatinib, or vehicle (n represents the number of animals). Statistically significant differences P < 0.05 or P < 0.001 compared with controls are indicated with * or **, respectively.

