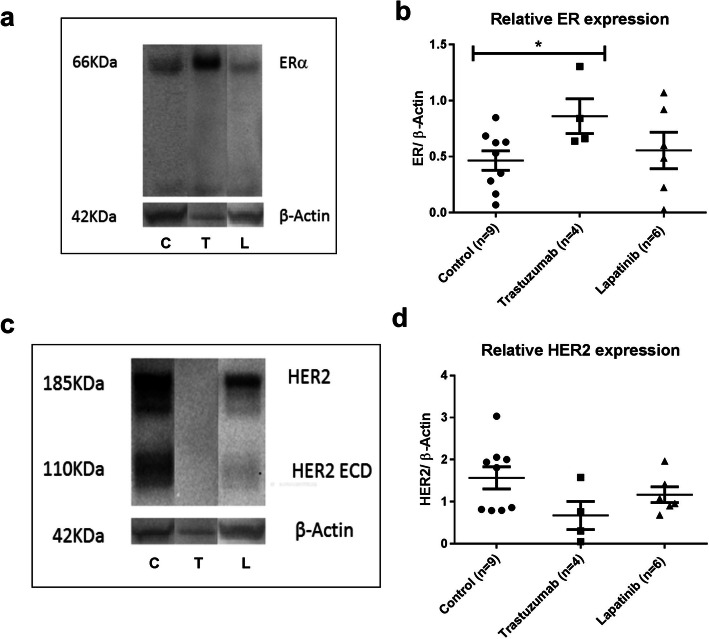
Fig. 3.
A representative example of the Western blot analysis of ERα (a) or HER2 (c) in SKOV-3 tumor xenografts from mice treated with trastuzumab (T), lapatinib (L), or vehicle (C). Western blot analysis of (b) ERα to β-actin protein ratio and (d) full-length HER2 to β-actin protein ratio in SKOV-3 tumor xenografts (n represents the number of mice). Statistically significant differences P < 0.05 compared with controls are indicated with *.

