
FIGURE 3.
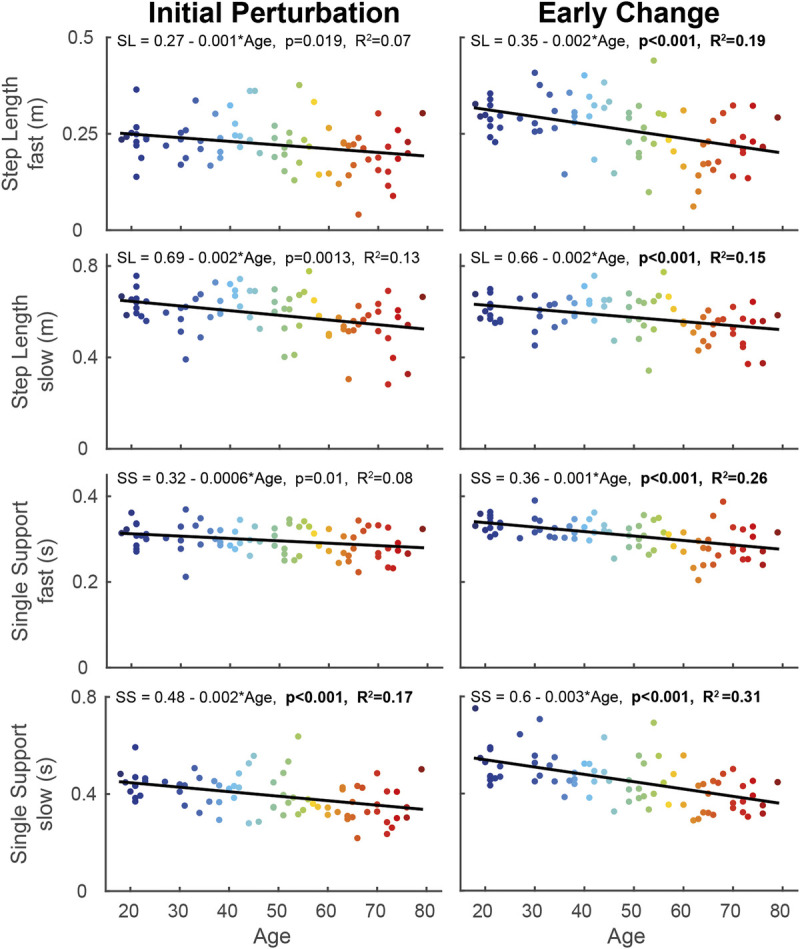
Linear regression models of step length and single support time of the fast and slow leg, with age as predictor during the initial perturbation (steps 1–5 of split-belt walking; left panel) and early change (steps 6–30 of split-belt walking; right panel) phases. The color of the data points changes with increasing age. The formula of the regression line is given at the top of each graph. When the models were significant, the P value and R2 value of the model are given in bold. SL, step length; SS, single support time.