Fig. 2.

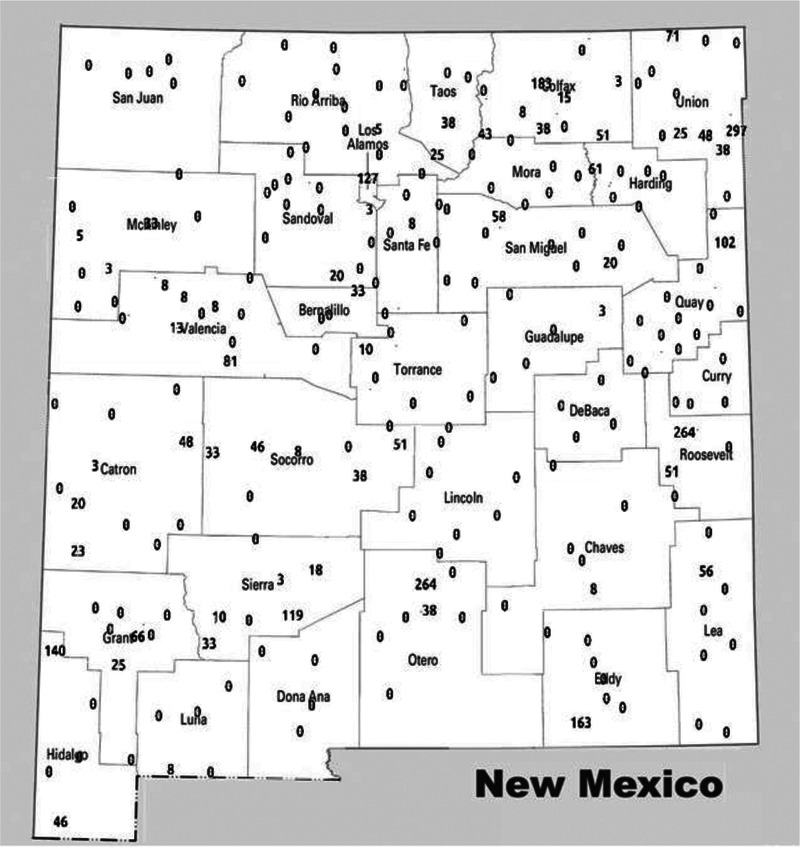
Map of recorded precipitation, expressed in tenths of millimeters per day, on 16 July 1945 in all measuring stations of New Mexico (derived from the Global Historical Climatology Network–Daily Database; Menne et al. 2012).

Map of recorded precipitation, expressed in tenths of millimeters per day, on 16 July 1945 in all measuring stations of New Mexico (derived from the Global Historical Climatology Network–Daily Database; Menne et al. 2012).