Abstract
Proton transfer reaction time-of-flight mass spectrometry (PTR-ToF-MS) is a powerful tool for real-time monitoring of trace concentrations of volatile organic compounds (VOCs). The sensitivity of PTR-ToF-MS also depends on the ability to effectively focus and transmit ions from the relatively high-pressure drift tube (DT) to the low-pressure mass analyzer. In the present study, a modular ion-funnel (IF) is placed adjacent to the DT of a PTR-ToF-MS instrument to improve the ion-focusing. IF consists of a series of electrodes with gradually decreasing orifice diameters. Radio frequency (RF) voltage and direct current (DC) electric field are then applied to the electrodes to get the ions focused. We investigated the effect of the RF voltage and DC field on the sensitivity of a pattern of VOCs including hydrocarbons, alcohols, aldehydes, ketones, and aromatic compounds. In a proof-of-concept study, the instrument operating both as normal DT (DC-mode) and at optimal IF conditions (RF-mode) was applied for the breath analysis of 21 healthy human subjects. For the range of investigated VOCs, an improvement of one order of magnitude in sensitivity was observed in RF-mode compared with DC-mode. Limits of detection could be improved by a factor of 2–4 in RF-mode compared with DC-mode. Operating the instrument in RF-mode allowed the detection of more compounds in the exhaled air compared with DC-mode. Incorporation of the IF considerably improved the performance of PTR-ToF-MS allowing the real-time monitoring of a larger number of potential breath biomarkers.
Graphical abstract
Electronic supplementary material
The online version of this article (10.1007/s00216-020-02846-8) contains supplementary material, which is available to authorized users.
Keywords: PTR-ToF-MS, Ion-funnel, Real-time mass spectrometry, Breath analysis, VOCs
Introduction
Proton transfer reaction mass spectrometry (PTR-MS) is an analytical technique that allows real-time monitoring of volatile organic compounds (VOCs) at low concentrations. It is widely used, e.g. in environmental sciences, food chemistry, homeland security, and breath analysis [1].
Since its introduction in the 1990s [2], PTR-MS has been improved in many ways. Inclusion of time-of-flight (ToF) mass analyzers has substantially overcome the limitations of the first generation of PTR quadrupole-MS (QMS) such as limited mass range and low mass resolution [3–5]. Modifications of the hollow cathode discharge ion source allowed to successfully use different chemical ionization agents such as H3O+, NO+, O2+, Kr+, Xe+, and NH4+, improving versatility and selectivity of the instrument [6, 7].
Sensitivity of PTR-MS is not solely determined by mass analyzers and detectors but it also depends on the ability to effectively focus and transmit ions from the relatively high-pressure drift tube (DT) to the low-pressure mass analyzer. As most of the ions crossing the DT do not exit through the small orifice at the MS interface, a large quantity of ion signal is lost. Ion-funnels (IF) represent a kind of ion guide that enhances sampling of ions through an orifice [8]. In an IF, a radio frequency (RF) voltage and a direct current (DC) electric field are applied to a series of electrodes with decreasing aperture sizes. The electrodes provide strong repulsive potentials at the edge of the electrode, radially focusing the ions. The first demonstration of an IF in PTR-MS was shown by Barber et al. [9]. In their instrument, the whole DT was set up as an IF with the first half used as a standard DT reactor running at a lower reduced electric field compared with the traditional DT. The RF electric field was only applied to the second section with decreasing orifice sizes. González-Méndez et al. [10] used the IF to manipulate the ion-molecule reactions and enhance the selectivity of PTR-MS. Brown et al. [11] reported that in this instrument, ion-focusing and proton transfer reaction both occurred in the IF region. This resulted in vastly different sensitivities for different compounds and in unusual fragmentation patterns. Recently, IONICON Analytik implemented a modular IF into proton transfer reaction time-of-flight mass spectrometry (PTR-ToF-MS) instruments. The aim of the present study was to characterize and optimize the IF-PTR-ToF instrument for trace VOC analysis. In a proof-of-concept setup, the instrument was then applied for real-time breath analysis in human subjects. The following questions were addressed in detail:
How does modification of IF parameters affect primary and VOC product ions?
Are PTR sensitivity and detection limits in VOC analysis significantly improved by the IF?
Are benefits of the IF technique suited to support applications such as real-time breath gas analysis in humans?
Methods
Ion-funnel PTR-ToF-MS instrument
All investigations were carried out using an online PTR-ToF-MS instrument equipped with a modular IF (PTR-TOF 1000 ultra, IONICON Analytik GmbH, Innsbruck, Austria; first-generation model (2017)). Figure 1 shows a schematic view of the instrument. The general working principle of PTR-ToF-MS has been described in several studies [4, 5]. Concisely, hydronium ions (H3O+) are produced in a hollow cathode glow discharge ion source from electron ionization of water vapour and are drawn by an electric field into the ion-molecule reaction region (DT). Here, the analyte sample is injected and the proton transfer reaction between the formed H3O+ and neutral analyte molecules (M) occurs: M + H3O+ → MH+ + H2O. Only molecules with proton affinities higher than water (PA (H2O) = 691 kJ mol−1) are ionized, a criterion that excludes the major constituents of air such as N2, O2, and CO2 but includes many trace gases such as most VOCs. The DT of the PTR-TOF 1000 ultra consists of a 7 cm long tube made of electrically isolated stainless steel rings. The rings are connected with resistors, and a drift voltage (Udrift) can be applied over the entire set of rings to induce an electric field (Edrift) in the DT. The modular IF is 2.2 cm long, it is placed adjacent to the DT and consists of 12 electrodes (6 with RF+ and 6 with RF−) with gradually decreasing orifice diameters, from 1 to 0.2 cm, placed at 0.1 cm distance of each other. In order to avoid the trapping of ions in axial potential wells, particularly those with low m/z, the IF electrode geometries used in this work fulfilled the following conditions:
where ρ is the electrode orifice radius and δ = d/π where d is the electrode spacing [12]. A radio frequency (RF) voltage and a direct current (DC) electric field are then applied to the electrodes. The DC electric field drives the ions axially through the IF toward the exit aperture. An additional alternating current (AC) is superimposed on the electrodes, with the RF on neighbouring electrodes being phase-shifted by 180°. In this way, the RF field creates a strongly repulsive potential near the surface of each electrode. In combination with the progressively decreasing aperture size, this serves to focus the ions radially. Table S1 (see Electronic Supplementary Material, ESM) summarizes details and operating conditions of the modular IF. The protonated VOCs then enter the pulse extraction region of the orthogonal acceleration reflectron ToF analyzer via a transfer lens system. The DT is interfaced to the transfer lens region via a pinhole of ~ 0.1 cm I.D. with the cone toward the transfer lens. The operating pressure in the DT (buffer gas number density, N) and the Edrift strength are important parameters, more commonly combined and expressed in terms of the reduced electric field (E/N). Edrift accelerates the ions but at the same time collisions with the buffer gas tend to slow them down. The E/N affects the reagent ion distribution. Increasing the E/N ratio results in more energetic collisions, which reduces the proportion of the water cluster ions (H3O+(H2O)n) in the DT but at the same time can increase the fragmentation of analytes [13]. Typical E/N values are in the range 90–150 Td, where 1 Td = 10−17 V cm2.
Fig. 1.
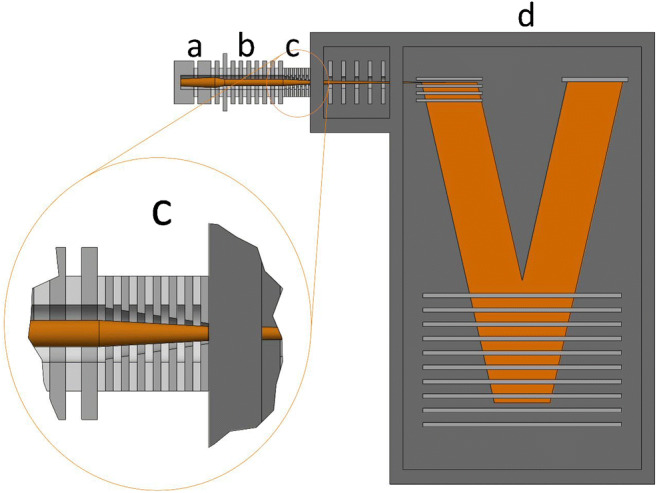
Schematic view of the PTR-ToF 1000 ultra setup: (a) hollow cathode ion source, (b) drift tube, (c) ion-funnel, (d) ToF mass analyzer
Within the standard PTR DT, Edrift variation is about 15% due to the ratio of the inner diameter and axial distance between the drift rings [14]. The additional RF voltage considerably increases this variation and E/N cannot be properly calculated any more. However, it is possible to define certain voltage settings in RF-mode which enable branching ratios of distinct analytes to be obtained that are comparable with the ones obtained with a classic PTR-ToF-MS instrument operated at a certain actual E/N (“TRU-E/N” method). Nevertheless, in the present paper, the E/N definition is omitted.
Ion-funnel characterization
Gas standard generation
The IF characterization was performed using a multicomponent gas VOC mix (IONICON Analytik GmbH, Innsbruck, Austria) including methanol, acetonitrile, acetaldehyde, ethanol, 2-propenal, acetone, isoprene, 2-butenal, 2-butanone, benzene, toluene, o-xylene, chlorobenzene, α-pinene, and 1,2-dichlorobenzene at concentrations of ~ 1ppmV. The VOC mix was subjected to a 100-fold dynamic dilution in pure nitrogen (purity 5.0, Linde, Vienna, Austria) by means of a liquid calibration unit (LCU, IONICON Analytik, Innsbruck, Austria) to generate a standard mixture with approximately 10 ppbV of each component. The working principle of the LCU involves the introduction of a liquid standard solution into a carrier gas stream, by forcing it through a nebuliser (X175, Burgener Research Inc., UK) and spraying the solution into an evaporation chamber at a defined temperature. This results in a rapid evaporation. The generated gaseous standard mixture can then be measured or collected directly at the output of the evaporation chamber. Two liquid ports (1–50 μl min−1), one carrier gas port (1–1000 ml min−1), and two additional gas ports (1–100 ml min−1), controlled by mass flow controllers (Bronkhorst High-Tech B.V., Ruurlo, Netherlands), enable the generation of complex standard mixtures. VOC standards can be prepared from either liquid solutions or gases, or even from both at the same time. In addition, defined amounts of humidity can be added by adding pure water via one of the two liquid ports [15].
In this study, the LCU flow was kept constant at 1000 ml min−1 for all experiments, the LCU temperature was 75 °C and the humidity was adjusted by adding pure water (HPLC grade).
Experimental design
The standard mixture was introduced into the DT via a 1.5 m long polyether ether ketone (PEEK) transfer line (ID: 0.75 mm, Restek, Bellafonte, PA) that was directly connected to the outlet of the LCU. The transfer line temperature was 75 °C and the sampling flow was 100 ml min−1. The signal intensity was recorded for each m/z while the settings of the IF region were varied. Operating the instrument in RF-mode (RF on), the DC electric field applied to the IF was varied in the range of 4.5–27 V/cm while the RF voltage was varied in the range of 40–200 V peak-to-peak (Vp-p) at 4.5 MHz. These testing ranges were decided upon after preliminary measurements showed that these settings approximate the best operating conditions. The entire experimental design was repeated at two different Edrift strength, 66 V/cm and 48 V/cm, and using both dry and humid samples (absolute humidity 47 g m−3) (ESM Table S2). These two sampling conditions will be referred in the text as “dry” and “humid” conditions, respectively.
When the instrument was operated only with the DC field applied to the IF region (DC-mode), the RF voltage was set to zero and the DC field was set at the same Edrift value in order to have a homogeneous electric field along the DT/IF regions.
For the whole experimental design, the DT/IF pressure was 2.3 mbar, the DT temperature was 75 °C, and the integration time was 1 s.
Three replicates were measured for each experimental setup, then the results were averaged and background signals were subtracted.
Human breath samples
All experiments were performed in accordance with the guidelines laid down in the Declaration of Helsinki and approved by the ethics committee at the University Medical Center Rostock. Informed consent was obtained from 21 healthy human subjects (aged between 20 and 45 years). Demographic parameters such as height, body weight, age, sex, and smoking habits were recorded for each volunteer (ESM Table S3). Volunteers were asked to breathe spontaneously and continuously over 3 min through a sterile mouth piece directly connected to the PTR transfer line in side stream mode by means of a T-piece. During the first minute of measurement, the PTR-ToF-MS instrument was operated in RF mode: Edrift was 66 V/cm, RF voltage was 120 Vp-p, and DC field was 13.5 V/cm. During the second minute of measurement, the operating mode of the instrument was switched from RF-mode to DC-mode. During the third minute of measurement, the instrument was operated in DC-mode: RF voltage was 0 Vp-p and both Edrift and DC field were 66 V/cm.
For breath measurements, the PTR transfer line temperature was 75 °C, DT temperature was 75 °C, and DT pressure was 2.3 mbar. For breath measurements, the integration time was 200 ms.
Data processing
The ion yields of all m/z were measured in counts per second (cps) and compounds were identified by means of their protonated m/z and isotopic patterns. The normalization of the measured ion intensities to the H3O+ counts in combination with the water-cluster ion counts is standard practice in PTR-ToF-MS data treatment [16]. However, in the present paper, the normalization to reagent ions was omitted in order to reflect the actual sensitivity of the instrument, which would be masked by normalization.
Both breath and standard files were processed using the software PTR-MS viewer v. 3.2.8 (IONICON Analytik GmbH, Innsbruck, Austria).
For breath measurements, expiratory and inspiratory phases were recognized by means of a custom-made data processing algorithm called “breath tracker” (MATLAB version 7.12.0.635, R2011a). The function of the algorithm has been described previously [17]. Briefly, an endogenous compound that has a sufficiently abundant signal intensity in expiration is used as a tracker to differentiate between alveolar and inspired phases. Acetone, isoprene, or carbon dioxide is usually used for this purpose. Expiratory and inspiratory phases determined by means of the algorithm were then applied to all m/z of interest.
Results
Ion-funnel characterization
H3O+·(H2O)n (n = 0, 1, and 2) reagent ions
Figure 2 (a, b) shows the variation of H3O+, protonated water clusters, and O2+ and NO+ measured intensities as function of RF voltage. The signal intensities of H3O+, H2O·H3O+, and O2+ are too high to be measured directly because of detector saturation. Therefore, the signal intensities at m/z = 21 corresponding to H318O+, at m/z = 39 corresponding to H2O·H318O+ and at m/z = 34 corresponding to 18O16O+ were recorded and corrected by the natural isotope abundances.
Fig. 2.
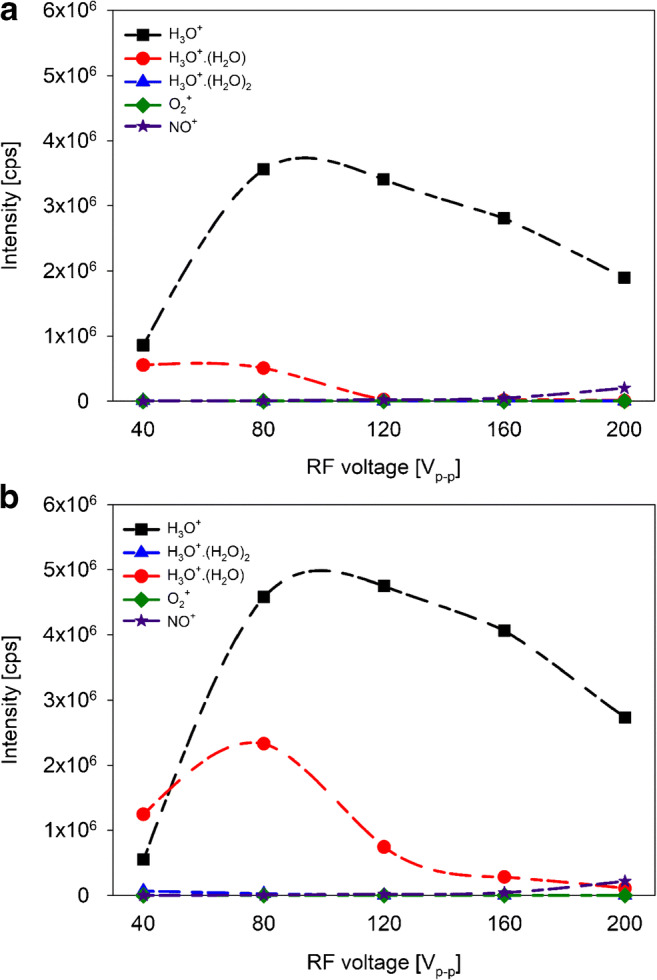
Ion intensities in counts per second (cps) of the water reagent ions (H3O+·(H2O)n, n = 0, 1, and 2) and parasitic ions O2+ and NO+ present in the DT under dry (a) and humid (b) conditions as a function of RF voltage. DC was 13.5 V/cm and Edrift was 66 V/cm
H3O+ intensity showed its maximum value at RF = 80 Vp-p under dry conditions (Fig. 2 (a)) and at RF = 120 V under humid conditions (Fig. 2 (b)). As the RF voltage decreases, the H3O+ signal intensity decreases. At the same time, an increase of the water cluster intensities was observed with decreasing RF voltage. H3O+·H2O showed its maximum value at RF = 40 Vp-p under dry conditions and at RF = 80 Vp-p under humid conditions. Nevertheless, at RF = 40 Vp-p under humid conditions, H3O+·H2O showed a higher intensity than H3O+.
The protonated water trimer was only observed under humid conditions and at RF = 40 Vp-p. Intensities of parasitic ions O2+ and NO+ only increased only at high RF voltages (> 160 Vp-p) under both dry and humid conditions. H3O+·(H2O)2 and O2+ intensities were up to six orders of magnitude smaller compared with that of the protonated water dimer.
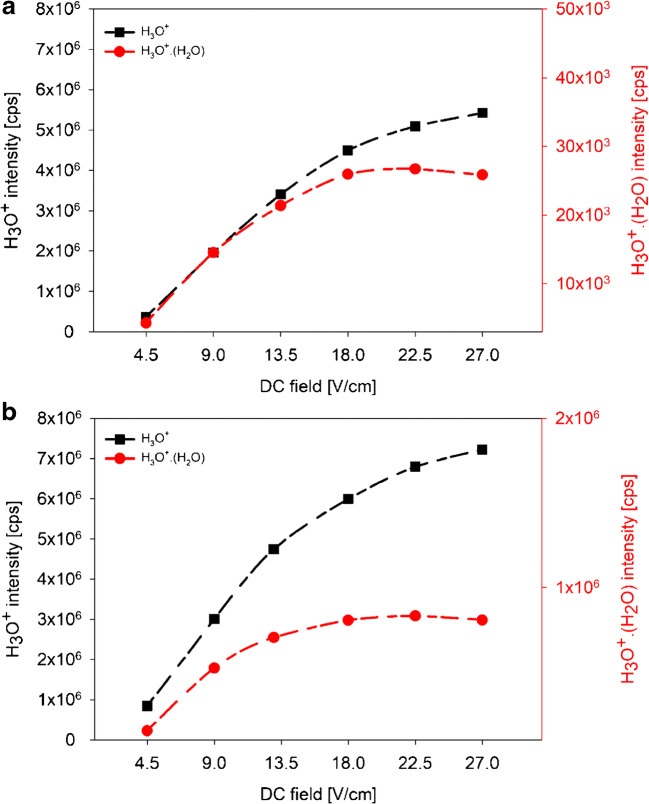
Figure 3 (a, b) shows the variation of the H3O+ and H3O+·H2O intensities as function of DC field. Due to the large difference between the intensities of the two reagent ions, H3O+·H2O intensity is displayed on a second Y-axis. The H3O+ intensity increased with increasing DC field with its maximum value at DC = 27 V/cm under both dry (Fig. 3 (a)) and humid (Fig. 3 (b)) conditions. In contrast, H3O+·H2O showed its maximum value at DC = 22.5 V/cm under both dry and humid conditions.
Fig. 3.
Ion intensities in counts per second (cps) of H3O+ and H3O+·(H2O) present in the DT under dry (a) and humid (b) conditions as a function of the DC field (V/cm). RF voltage was 120 Vp-p and Edrift was 66 V/cm
ESM Fig. S1 (a, b) shows the variation of H3O+, protonated water clusters, and O2+ and NO+ measured intensities as function of RF voltage at Edrift = 48 V/cm. ESM Fig. S2 (a, b) shows the variation of the H3O+ and H3O+·H2O intensities as function of DC voltage at Edrift = 48 V/cm. H3O+ intensity showed similar trends of those showed at Edrift = 66 V/cm. In contrast, substantial differences were found for the protonated water clusters. Under dry conditions (ESM Fig. S1 (a)) at RF = 40 Vp-p and under humid conditions (ESM Fig. S1 (b)) at RF = 80 Vp-p, H3O+·H2O became the most abundant reagent ion in the DT. Under humid conditions at RF = 40 Vp-p, H3O+·(H2O)2 showed a higher intensity than H3O+.
In DC-mode at Edrift = 48 V/cm under humid conditions, H3O+·H2O represent about 65% of the total water reagent ions. In contrast, under dry conditions, they represent about the 15% of the total water reagent ions. In DC-mode at Edrift = 66 V/cm, protonated water clusters are present in low concentrations under both dry and humid conditions. Under humid conditions, H3O+·H2O represent about 8% of the total water reagent ions; under dry conditions, they represent about 1% of the total water reagent ions.
Effect of RF voltage and DC field on VOC signal intensities
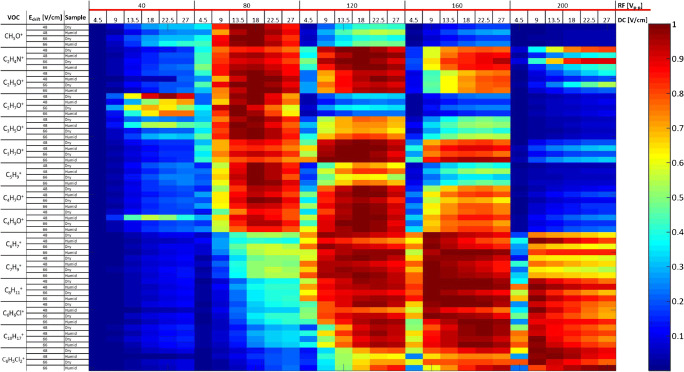
Figure 4 shows effects of RF voltage (40–200 Vp-p) and DC field (4.5–27 V/cm) onto intensities of all investigated VOCs.
Fig. 4.
Effect of RF voltage (40–200 Vp-p) and DC field (4.5–27 V/cm) on VOC intensities. The whole experiment was conducted at Edrift of 48 V/cm and 66 V/cm, with dry and humid samples (humidity of 47 g m−3). Data were normalized to maximum values to emphasize relative changes
Figure 5 shows signal intensities of acetaldehyde, acetone, benzene, and dichlorobenzene as a function of RF voltage.
Fig. 5.
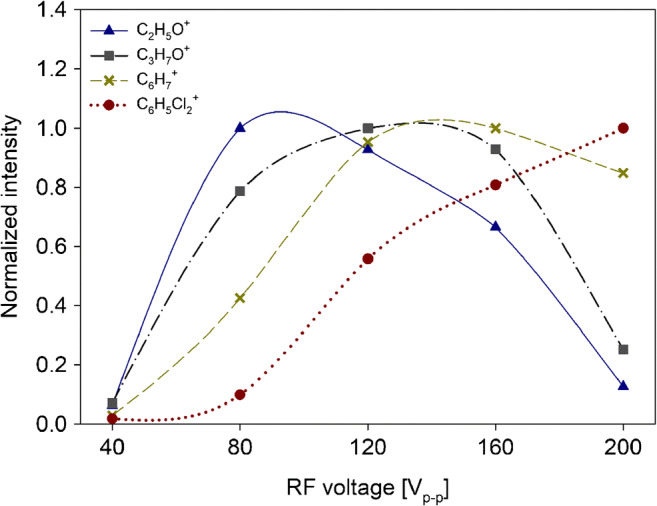
Intensities of acetaldehyde (blue triangle), acetone (grey square), benzene (yellow cross), and dichlorobenzene (red round) as function of RF voltage. DC field was 13.5 V/cm and Edrift was 66 V/cm. Data were normalized onto respective maximum values to emphasize the relative changes
Intensities of acetaldehyde, methanol, ethanol, 2-propenal, and isoprene showed their maximum values at RF = 80 Vp-p. In contrast, intensities of acetone, acetonitrile, 2-butenal, and butanone showed their maximum values at RF = 120 Vp-p. Aromatic compounds, such as benzene, toluene, o-xylene, chlorobenzene, and α-pinene, showed their maximum intensities at RF = 160 Vp-p. Intensity of dichlorobenzene showed its maximum at RF = 200 Vp-p.
Figure 6 shows the measured intensities of the acetaldehyde, acetone, benzene, and dichlorobenzene as function of DC field. Intensities of most of the investigated compounds showed a substantial increase when the DC field was increased from 4.5 to 13.5 V/cm; when the DC voltage was further increased up to 27 V/cm, they showed variations < 10%. This was with the exception of dichlorobenzene which showed steadily increasing intensity with increasing DC voltage, with its maximum at DC = 27 V/cm.
Fig. 6.
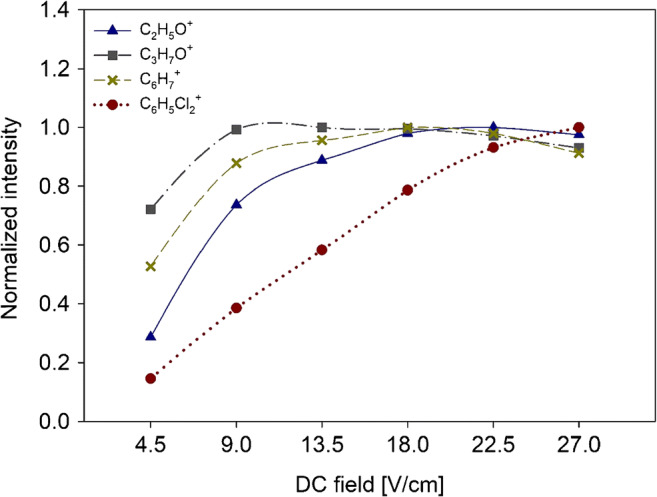
Intensities of acetaldehyde (blue triangle), acetone (grey square), benzene (yellow cross), and dichlorobenzene (red round) as function of DC voltage. RF voltage was 120 Vp-p and Edrift was 66 V/cm. Data were normalized onto respective maximum values to emphasize the relative changes
Table 1 compares sensitivities and limits of detection (LODs) calculated for DC-mode and RF-mode for all the investigated VOCs. Sensitivity is expressed as ion count rate per second per part-per-billion volume mixing ratio of supplied analyte (cps/ppbV). LODs were calculated for 1 s of integration time using the “3σ method” with σ being the standard deviation of the background noise level [18]. The DC-mode data were collected at Edrift = 66 V/cm, RF = 0 Vp-p, and DC = 66 V/cm under humid conditions. The RF-mode data were collected at Edrift = 66 V/cm, RF = 120 Vp-p, and DC = 13.5 V/cm under humid conditions. At these conditions, switching from DC-mode to RF-mode led to an improvement in sensitivity of about 1 order of magnitude for most of the investigated compounds with the exception of methanol, ethanol, and dichlorobenzene. In contrast, only an improvement by a factor of 2–4 was observed for the LODs in RF-mode compared with DC-mode.
Table 1.
Comparison of sensitivities and LODs for DC-mode and RF-mode of all investigated VOCs. LODs were calculated for 1 s of integration time. The DC-mode data were collected at Edrift = 66 V/cm, RF = 0 Vp-p, and DC = 66 V/cm under humid conditions. The RF-mode data were collected at Edrift = 66 V/cm, RF = 120 Vp-p, and DC = 13.5 V/cm under humid conditions
| Sensitivity (cps ppbV−1) | LOD (ppbV) | |||||
|---|---|---|---|---|---|---|
| Compound (m/z) | DC-mode | RF-mode | RF-mode/DC-mode | DC-mode | RF-mode | RF-mode/DC-mode |
| Methanol (33) | 27.5 | 116.5 | 4.2 | 0.735 | 0.432 | 1.7 |
| Acetonitrile (42) | 46.7 | 418.2 | 8.6 | 0.337 | 0.11 | 3.1 |
| Acetaldehyde (45) | 56.5 | 458.1 | 8.1 | 0.66 | 0.245 | 2.7 |
| Ethanol (47) | 3.4 | 18.2 | 5.3 | 12.319 | 8.31 | 1.5 |
| 2-Propenal (57) | 43 | 406.3 | 9.4 | 0.301 | 0.146 | 2.1 |
| Acetone (59) | 103.6 | 1008.3 | 9.7 | 0.26 | 0.09 | 2.9 |
| Isoprene (69) | 10 | 120.8 | 12.1 | 1.226 | 0.463 | 2.6 |
| 2-Butenal (71) | 65.8 | 701 | 10.7 | 0.163 | 0.069 | 2.4 |
| 2-Butanone (73) | 66.1 | 750.9 | 11.4 | 0.325 | 0.104 | 3.1 |
| Benzene (79) | 39.2 | 423.6 | 10.8 | 0.22 | 0.056 | 3.9 |
| Toluene (93) | 50.2 | 620.3 | 12.4 | 0.144 | 0.06 | 2.4 |
| o-Xylene (107) | 65.4 | 747.4 | 11.4 | 0.115 | 0.03 | 3.8 |
| Chlorobenzene (113) | 38.2 | 413.7 | 10.8 | 0.155 | 0.061 | 2.5 |
| α-Pinene (137) | 25.7 | 252.1 | 9.8 | 0.265 | 0.087 | 3 |
| 1,2-Dichlorobenzene (147) | 43.9 | 264.7 | 6.0 | 0.087 | 0.044 | 2 |
Application in human breath samples
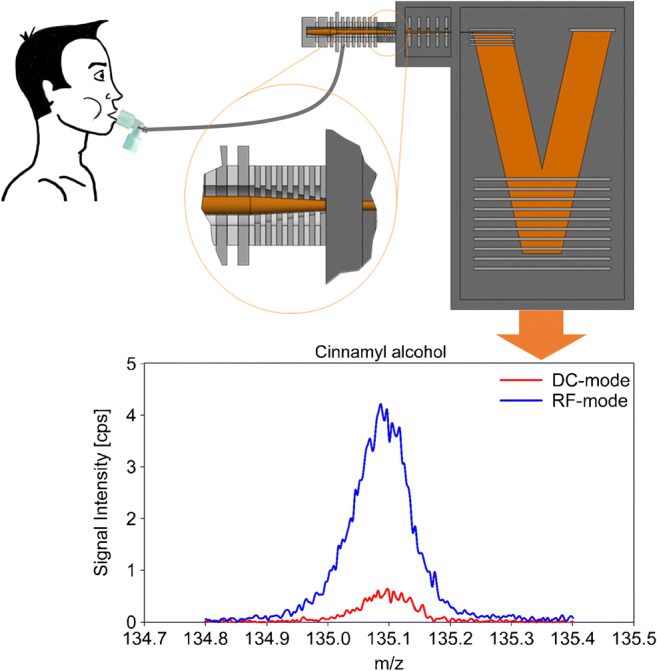
In a proof-of-concept study, the instrument operating both in DC-mode and RF-mode was applied for breath analysis of 21 human healthy subjects.
Table 2 contains the list of VOCs that could be detected in exhaled breath. Compounds that could only be detected in RF-mode are labelled using bold italic text. Concentrations of these compounds were below the LODs in DC-mode and above the LODs in RF-mode.
Table 2.
List of VOCs that could be detected from exhaled breath in real-time. Compounds that could only be detected in RF-mode compared with DC-mode are labelled using bold italic text. The DC-mode data were collected at Edrift = 66 V/cm, RF = 0 Vp-p, and DC = 66 V/cm. The RF-mode data were collected at Edrift = 66 V/cm, RF = 120 Vp-p, and DC = 13.5 V/cm
| Peak number | Measured mass (m/z) | Exact mass (m/z) | Mass accuracy (ppm) | Empirical formula | Concentration range (ppbV) | LOD DC-mode (ppbV) | LOD RF-mode (ppbV) | LOQ DC-mode (ppbV) | LOQ RF-mode (ppbV) | Potential compound |
|---|---|---|---|---|---|---|---|---|---|---|
| 1 | 33.031 | 33.033 | − 60.55 | CH4O+ | 37.401–364.033 | 0.735 | 0.432 | 2.426 | 1.426 | Methanol |
| 2 | 42.031 | 42.034 | − 71.37 | C2H4N+ | 2.443–76.18 | 0.337 | 0.11 | 1.112 | 0.363 | Acetonitrile |
| 3 | 47.046 | 47.049 | − 63.76 | C2H6O+ | 12.332–74.094 | 12.319 | 8.31 | 40.653 | 27.423 | Ethanol |
| 4 | 59.053 | 59.049 | 67.74 | C3H7O+ | 133.39–1043.864 | 0.26 | 0.09 | 0.858 | 0.297 | Acetone |
| 5 | 61.031 | 61.028 | 49.16 | C2H5O2+ | 4.328–40.298 | 0.865 | 0.763 | 2.855 | 2.518 | Acetic acid |
| 6 | 63.028 | 63.026 | 31.73 | C2H7S+ | 1.435–10.894 | 0.203 | 0.12 | 0.67 | 0.396 | Dimethylsulfide |
| 7 | 69.072 | 69.070 | 28.96 | C5H9+ | 31.166–193.766 | 1.226 | 0.463 | 4.046 | 1.528 | Isoprene |
| 8 | 71.052 | 71.049 | 42.22 | C4H7O+ | 0.25–6.957 | 0.163 | 0.069 | 0.538 | 0.228 | 2-Butenal |
| 9 | 73.069 | 73.065 | 54.75 | C4H9O+ | 1.26–3.769 | 0.325 | 0.104 | 1.073 | 0.343 | Butanone |
| 10 | 79.052 | 79.054 | − 25.30 | C6H7+ | 0.309–8.362 | 0.22 | 0.056 | 0.726 | 0.185 | Benzene |
| 11 | 87.073 | 87.080 | − 80.39 | C5H11O+ | 0.62–1.643 | 0.349 | 0.272 | 1.152 | 0.898 | Pentanal |
| 12 | 89.052 | 89.060 | − 89.83 | C4H9O2+ | 0.469–5.146 | 0.203 | 0.126 | 0.67 | 0.416 | Ethylacetate |
| 13 | 93.073 | 93.070 | 32.23 | C7H9+ | 0.413–7.61 | 0.144 | 0.06 | 0.475 | 0.198 | Toluene |
| 14 | 137.129 | 137.132 | − 21.88 | C10H17+ | 0.911–12.413 | 0.265 | 0.087 | 0.875 | 0.287 | Limonene |
| 15 | 49.008 | 49.010 | − 40.81 | CH5S+ | 0.194–2.452 | 0.354 | 0.073 | 1.168 | 0.241 | Methyl mercaptan |
| 16 | 68.053 | 68.049 | 58.78 | C4H6N+ | 0.067–0.558 | 0.141 | 0.032 | 0.465 | 0.106 | Pyrrole |
| 17 | 80.047 | 80.049 | − 24.98 | C5H6N+ | 0.068–0.713 | 0.215 | 0.039 | 0.71 | 0.129 | Pyridine |
| 18 | 85.063 | 85.065 | − 23.51 | C5H9O+ | 0.331–1.218 | 0.323 | 0.266 | 1.066 | 0.878 | 3-Penten-2-one |
| 19 | 91.055 | 91.057 | − 21.96 | C4H11S+ | 0.168–1.091 | 0.263 | 0.092 | 0.868 | 0.304 | Methyl propyl sulfide |
| 20 | 97.061 | 97.065 | − 41.21 | C6H9O+ | 0.248–3.97 | 0.334 | 0.13 | 1.102 | 0.429 | 2,5-Dimethylfuran |
| 21 | 101.055 | 101.060 | − 49.48 | C5H8O2+ | 0.218–0.737 | 0.261 | 0.195 | 0.861 | 0.644 | Coffee furanone |
| 22 | 105.056 | 105.054 | 19.04 | C4H9O3+ | 0.142–0.785 | 0.242 | 0.12 | 0.799 | 0.396 | β-Hydroxybutyric acid |
| 23 | 106.069 | 106.065 | 37.71 | C7H8N+ | 0.017–0.094 | 0.088 | 0.05 | 0.29 | 0.165 | Vinylpyridine |
| 24 | 108.074 | 108.081 | − 64.77 | C7H10N+ | 0.063–0.242 | 0.202 | 0.077 | 0.667 | 0.254 | o-Toluidine |
| 25 | 118.065 | 118.058 | 59.29 | C8H8N+ | 0.051–0.569 | 0.084 | 0.014 | 0.277 | 0.046 | Indole |
| 26 | 125.088 | 125.096 | − 63.95 | C8H13O+ | 0.042–0.343 | 0.168 | 0.089 | 0.554 | 0.294 | Acetylcyclohexene |
| 27 | 129.077 | 129.070 | 54.23 | C10H9+ | 0.07–0.153 | 0.161 | 0.059 | 0.531 | 0.195 | Naphthalene |
| 28 | 133.058 | 133.065 | − 52.61 | C9H9O+ | 0.042–0.142 | 0.12 | 0.04 | 0.396 | 0.132 | Cinnamaldehyde |
| 29 | 135.088 | 135.080 | 59.22 | C9H11O+ | 0.074–0.317 | 0.167 | 0.075 | 0.551 | 0.248 | Cinnamyl alcohol |
| 30 | 149.055 | 149.060 | − 33.54 | C9H9O2+ | 0.095–0.561 | 0.223 | 0.126 | 0.736 | 0.416 | Cinnamic acid |
| 31 | 151.110 | 151.112 | − 13.24 | C10H15O+ | 0.054–0.233 | 0.118 | 0.049 | 0.389 | 0.162 | Carvone |
Concentrations and LODs and LOQs were calculated applying the kinetic theory [19, 20].
Discussion
Incorporation of a modular IF adjacent to the DT led to a substantial improvement in sensitivity and LODs of the PTR-ToF-MS instrument. Improved sensitivities allowed the detection of a broader range of VOCs from human breath samples in real-time.
Intensities determined for water reagent ions (H3O+·(H2O)n, n = 0, 1, and 2) and for protonated VOCs showed a considerable dependence on RF voltage and DC field applied to the IF region. Highest intensities for H3O+ were observed in the RF range 80–120 Vp-p and at DC = 27 V/cm. At lower and higher RF voltages, the focusing effect of the funnel was lost and ion transfer was less efficient. High RF voltages increase the kinetic energy of molecules. As binding forces in the water clusters are weak when compared with normal chemical bonding, this will lead to collisional decomposition of water clusters long before fragmentation of chemical compounds occurs. Higher H3O+ intensities in humid samples were most probably due to back diffusion of sample gas from the DT into the ion source generating additional H3O+ [15, 21, 22]. O2+ and NO+ were present in low intensities and were observed in RF-mode only at high RF voltage (> 160 Vp-p) as a result of improved ion transmission [13, 23].
VOCs showed maximum intensities at substance-specific DC field and RF voltage. In agreement with IF theory, cut-off values occurred at low (< 50 Vp-p) RF voltages for all VOCs and at high (> 160 Vp-p) RF voltages for low-mass compounds (m/z < 90). At low RF voltages, the focusing effect of IF is lost for low and high masses. In a substance-specific way, higher masses show maximum transmission at high (> 120 Vp-p) RF voltages due to the dependency of effective potential onto m/z. Decreasing transmission of low masses at high RF voltages is attributed to diffusional loss of molecules due to the relatively high kinetic energy of low-mass molecules under these conditions [12, 24]. In addition, fragmentation may contribute to this effect, as we observed a 10% increase in acetaldehyde fragmentation with increasing RF voltage. Up to 50% fragmentation was reported by Barber et al. under similar conditions.
In contrast to oxygen-containing aliphatic substances, aromatic compounds showed increasing ion yields of the protonated monomers even at high RF voltages where non-aromatic substances already exhibited decreasing intensities. Enhanced ability of aromatic systems to stabilize ionic states may explain efficient generation of molecule ions without losses through fragmentation even at high RF voltages. This hypothesis is further confirmed by dichlorobenzene showing an almost linear increase with increasing RF voltages, most probably due to the additional charge-stabilizing effects of the chlorine atoms.
In contrast to previous setups, with the IF used in this study, sensitivity increases were rather uniform, i.e. approximately one order of magnitude for all investigated compounds. This is a strong indicator that the IF does not have major effects onto the ion chemistry within the DT itself. Therefore, the advantages of PTR-MS, e.g. quantification without calibration, are preserved. Although Brown and Barber et al. reported relative increases in sensitivity of 1–2 orders of magnitude for single compounds (acetaldehyde 45×, acetone 200×), absolute sensitivities for a broad range of compounds reported in our study were in general higher, e.g. 10 times higher for methanol and 2 times higher for acetaldehyde. Higher improvements in relative sensitivity as well as higher fragmentation rates reported by Barber and Brown et al. can thus be attributed to different geometries of IF and DT in their instruments.
Characterization and optimization of DT conditions, RF voltage, and DC field and effects of humidity are of general importance for any IF-PTR-ToF instrument and can therefore be beneficial for the whole community [20]. In addition, the modular IF described in this study can be implemented into several PTR-ToF-MS instruments.
The impact of the IF onto quantification can be seen when LODs and LOQs are looked upon. As the applied IF will improve transmission of the ions, in parallel to the desired effects, increased ion yields will also induce growing background noise. Thus, the “raw” gain in ion counts will not directly translate into identical improvements of LODs and LOQs. LODs and LOQs substantially depend on noise inherent in a PTR-MS signal. This noise can be described by a Poisson distribution: the 1σ error in a measurement that is derived from counting a total of N ions is , with τ being the integration time [19, 25, 26]. Taking this into account, LODs and LOQs could effectively be improved by a factor of 2–4 when the instrument was switched from DC-mode to RF-mode. Hence, just determining increases in ion yields may lead to overestimation of the instrument performances for quantitative analysis. For real-life applications, e.g. trace gas analysis in breath, LODs and LOQs have to be determined to take into account all effects of DC field and RF voltage applied within the IF.
Especially in diseased states, breath VOC concentrations may change quickly and abruptly. Hence, only real-time monitoring can provide complete and comprehensive information from breath VOC analysis [27–29]. PTR-ToF-MS with integration time of ≥ 200 ms enables breath-resolved continuous monitoring of breath volatiles. In this pilot study, the range of detectable volatile substances was significantly enlarged through application of IF technology.
Conclusion
The spectrum of detectable VOCs in real-time breath analysis was considerably enhanced through the application of IF technology. The IF can be tuned in order either to obtain the best operating conditions for a specific compound of interest or to realize operating conditions which represent the best compromise for the acquisition of a large number of compounds. In contrast to previous setups, the IF used in this study did not have major effects onto ion chemistry within the DT itself and therefore offers optimal conditions for VOC screening in biomedical applications.
Electronic supplementary material
(PDF 926 KB)
Acknowledgements
Giovanni Pugliese acknowledges useful discussions with Professor C. A. Mayhew (Head of Molecular Physics Group at the University of Birmingham, Director of the Institute for Breath Research at the Leopold-Franzens-Universität Innsbruck, Coordinator IMPACT EU ITN) during his visit at the Rostock University Medical Center in July 2019. Finally, we thank all the volunteers and the IONICON Analytik GmbH employees for participating and supporting this study.
Funding information
Open Access funding provided by Projekt DEAL. This study was financially funded by the European Union’s Horizon 2020 research and innovation programme under the Marie Skłodowska-Curie grant agreement no. 674911-IMPACT. Giovanni Pugliese and Felix Piel are Early Stage Researchers within the IMPACT programme.
Compliance with ethical standards
Conflict of interest
Felix Piel and Philipp Sulzer work for IONICON Analytik GmbH, which provided the instrument used in this study. The other authors declare that they have no conflict of interest.
Research involving human participants
All experiments were performed in accordance with the guidelines laid down in the Declaration of Helsinki and approved by the ethics committee at University Medical Center Rostock.
Informed consent
Informed consent was obtained from all volunteers.
Footnotes
Publisher’s note
Springer Nature remains neutral with regard to jurisdictional claims in published maps and institutional affiliations.
References
- 1.Ellis AM, Mayhew CA. Proton transfer reaction mass spectrometry: principles and applications. John Wiley & Sons. 2013.
- 2.Hansel A, Jordan A, Holzinger R, Prazeller P, Vogel W, Lindinger W. Proton-transfer reaction mass-spectrometry - online trace gas-analysis at the ppb level. Int J Mass Spectrom. 1995;149:609–619. doi: 10.1016/0168-1176(95)04294-U. [DOI] [Google Scholar]
- 3.Graus M, Müller M, Hansel A. High resolution PTR-TOF: quantification and formula confirmation of VOC in real time. J Am Soc Mass Spectrom. 2010;21:1037–1044. doi: 10.1016/j.jasms.2010.02.006. [DOI] [PubMed] [Google Scholar]
- 4.Blake RS, Whyte C, Hughes CO, Ellis AM, Monks PS. Demonstration of proton-transfer reaction time-of-flight mass spectrometry for real-time analysis of trace volatile organic compounds. Anal Chem. 2004;76:3841–3845. doi: 10.1021/ac0498260. [DOI] [PubMed] [Google Scholar]
- 5.Jordan A, Haidacher S, Hanel G, Hartungen E, Märk L, Seehauser H, Schottkowsky R, Sulzer P, Märk TD. A high resolution and high sensitivity proton-transfer-reaction time-of-flight mass spectrometer (PTR-TOF-MS) Int J Mass Spectrom. 2009;286:122–128. doi: 10.1016/j.ijms.2009.07.005. [DOI] [Google Scholar]
- 6.Müller M, Piel F, Gutmann R, Sulzer P, Hartungen E, Wisthaler A. A novel method for producing NH4+ reagent ions in the hollow cathode glow discharge ion source of PTR-MS instruments. Int J Mass Spectrom. 2020;447:116254. doi: 10.1016/j.ijms.2019.116254. [DOI] [Google Scholar]
- 7.Jordan A, Haidacher S, Hanel G, Hartungen E, Herbig J, Märk L, Schottkowsky R, Seehauser H, Sulzer P, Märk TD. An online ultra-high sensitivity proton-transfer-reaction mass-spectrometer combined with switchable reagent ion capability (PTR+SRI−MS) Int J Mass Spectrom. 2009;286:32–38. doi: 10.1016/j.ijms.2009.06.006. [DOI] [Google Scholar]
- 8.Shaffer SA, Tang K, Anderson GA, Prior DC, Udseth HR, Smith RD. A novel ion funnel for focusing ions at elevated pressure using electrospray ionization mass spectrometry. Rapid Commun Mass Spectrom. 1997;11:1813–1817. doi: 10.1002/(SICI)1097-0231(19971030)11:16<1813::AID-RCM87>3.0.CO;2-D. [DOI] [Google Scholar]
- 9.Barber S, Blake RS, White IR, Monks PS, Reich F, Mullock S, Ellis AM. Increased sensitivity in proton transfer reaction mass spectrometry by incorporation of a radio frequency ion funnel. Anal Chem. 2012;84:5387–5391. doi: 10.1021/ac300894t. [DOI] [PubMed] [Google Scholar]
- 10.González-Méndez R, Watts P, Olivenza-León D, Reich DF, Mullock SJ, Corlett CA, Cairns S, Hickey P, Brookes M, Mayhew CA. Enhancement of compound selectivity using a radio frequency ion-funnel proton transfer reaction mass spectrometer: improved specificity for explosive compounds. Anal Chem. 2016;88:10624–10630. doi: 10.1021/acs.analchem.6b02982. [DOI] [PubMed] [Google Scholar]
- 11.Brown PA, Cristescu SM, Mullock SJ, Reich DF, Lamont-Smith CS, Harren FJM. Implementation and characterization of an RF ion funnel ion guide as a proton transfer reaction chamber. Int J Mass Spectrom. 2017;414:31–38. doi: 10.1016/j.ijms.2017.01.001. [DOI] [Google Scholar]
- 12.Kelly RT, Tolmachev AV, Page JS, Tang K, Smith RD. The ion funnel: theory, implementations, and applications. Mass Spectrom Rev. 2010;29:294–312. doi: 10.1002/mas.20232. [DOI] [PMC free article] [PubMed] [Google Scholar]
- 13.Blake RS, Monks PS, Ellis AM. Proton-transfer reaction mass spectrometry. Chem Rev. 2009;109:861–896. doi: 10.1021/cr800364q. [DOI] [PubMed] [Google Scholar]
- 14.Breitenlechner M, Fischer L, Hainer M, Heinritzi M, Curtius J, Hansel A. PTR3: an instrument for studying the lifecycle of reactive organic carbon in the atmosphere. Anal Chem. 2017;89:5824–5831. doi: 10.1021/acs.analchem.6b05110. [DOI] [PubMed] [Google Scholar]
- 15.Trefz P, Schubert JK, Miekisch W. Effects of humidity, CO2 and O2 on real-time quantitation of breath biomarkers by means of PTR-ToF-MS. J Breath Res. 2018;12:026016. doi: 10.1088/1752-7163/aa9eea. [DOI] [PubMed] [Google Scholar]
- 16.de Gouw JA, Goldan PD, Warneke C, Kuster WC, Roberts JM, Marchewka M, et al. Validation of proton transfer reaction-mass spectrometry (PTR-MS) measurements of gas-phase organic compounds in the atmosphere during the New England Air Quality Study (NEAQS) in 2002. J Geophys Res Atmospheres. 2003;108. 10.1029/2003JD003863.
- 17.Trefz P, Schmidt M, Oertel P, Obermeier J, Brock B, Kamysek S, Dunkl J, Zimmermann R, Schubert JK, Miekisch W. Continuous real time breath gas monitoring in the clinical environment by proton-transfer-reaction-time-of-flight-mass spectrometry. Anal Chem. 2013;85:10321–10329. doi: 10.1021/ac402298v. [DOI] [PubMed] [Google Scholar]
- 18.Sulzer P, Hartungen E, Hanel G, Feil S, Winkler K, Mutschlechner P, Haidacher S, Schottkowsky R, Gunsch D, Seehauser H, Striednig M, Jürschik S, Breiev K, Lanza M, Herbig J, Märk L, Märk TD, Jordan A. A proton transfer reaction-quadrupole interface time-of-flight mass spectrometer (PTR-QiTOF): high speed due to extreme sensitivity. Int J Mass Spectrom. 2014;368:1–5. doi: 10.1016/j.ijms.2014.05.004. [DOI] [Google Scholar]
- 19.de Gouw J, Warneke C. Measurements of volatile organic compounds in the earth’s atmosphere using proton-transfer-reaction mass spectrometry. Mass Spectrom Rev. 2007;26:223–257. doi: 10.1002/mas.20119. [DOI] [PubMed] [Google Scholar]
- 20.Yuan B, Koss AR, Warneke C, Coggon M, Sekimoto K, de Gouw JA. Proton-transfer-reaction mass spectrometry: applications in atmospheric sciences. Chem Rev. 2017;117:13187–13229. doi: 10.1021/acs.chemrev.7b00325. [DOI] [PubMed] [Google Scholar]
- 21.Beauchamp J, Herbig J, Dunkl J, Singer W, Hansel A. On the performance of proton-transfer-reaction mass spectrometry for breath-relevant gas matrices. Meas Sci Technol. 2013;24:125003. doi: 10.1088/0957-0233/24/12/125003. [DOI] [Google Scholar]
- 22.Smith D, Španěl P, Herbig J, Beauchamp J. Mass spectrometry for real-time quantitative breath analysis. J Breath Res. 2014;8:027101. doi: 10.1088/1752-7155/8/2/027101. [DOI] [PubMed] [Google Scholar]
- 23.Trefz P, Pugliese G, Brock B, Schubert J, Miekisch W. Effects of elevated oxygen levels on VOC analysis by means of PTR-ToF-MS. J Breath Res. 2019;13:046004. 10.1088/1752-7163/ab28ec. [DOI] [PubMed]
- 24.Shaffer SA, Tolmachev A, Prior DC, Anderson GA, Udseth HR, Smith RD. Characterization of an improved electrodynamic ion funnel interface for electrospray ionization mass spectrometry. Anal Chem. 1999;71:2957–2964. doi: 10.1021/ac990346w. [DOI] [PubMed] [Google Scholar]
- 25.Warneke C, de Gouw JA, Kuster WC, Goldan PD, Fall R. Validation of atmospheric VOC measurements by proton-transfer- reaction mass spectrometry using a gas-chromatographic preseparation method. Environ Sci Technol. 2003;37:2494–2501. doi: 10.1021/es026266i. [DOI] [PubMed] [Google Scholar]
- 26.Hayward S, Hewitt CN, Sartin JH, Owen SM. Performance characteristics and applications of a proton transfer reaction-mass spectrometer for measuring volatile organic compounds in ambient air. Environ Sci Technol. 2002;36:1554–1560. doi: 10.1021/es0102181. [DOI] [PubMed] [Google Scholar]
- 27.Sukul P, Schubert JK, Oertel P, Kamysek S, Taunk K, Trefz P, Miekisch W. FEV manoeuvre induced changes in breath VOC compositions: an unconventional view on lung function tests. Sci Rep. 2016;6:28029. doi: 10.1038/srep28029. [DOI] [PMC free article] [PubMed] [Google Scholar]
- 28.Brock B, Kamysek S, Silz J, Trefz P, Schubert JK, Miekisch W. Monitoring of breath VOCs and electrical impedance tomography under pulmonary recruitment in mechanically ventilated patients. J Breath Res. 2017;11:016005. doi: 10.1088/1752-7163/aa53b2. [DOI] [PubMed] [Google Scholar]
- 29.Pugliese G, Trefz P, Brock B, Schubert J, Miekisch W. Extending PTR based breath analysis to real-time monitoring of reactive volatile organic compounds. Analyst. 2019;144:7359. 10.1039/C9AN01478K. [DOI] [PubMed]
Associated Data
This section collects any data citations, data availability statements, or supplementary materials included in this article.
Supplementary Materials
(PDF 926 KB)


