
Fig. 4.
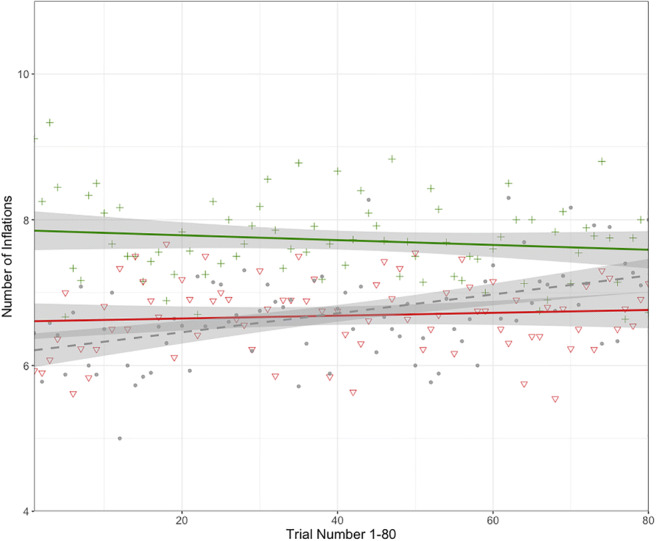
Risk taking in the BART as a function of Trials 1–80, for the baseline block (dashed line) and each of the experimental blocks following positive (top solid line) and negative (bottom solid line) economic forecasting. Individual points (baseline = small solid dots; negative forecasting = triangle symbol; positive forecasting = cross symbol) signify aggregate responses across trials. Shaded regions represent 95% confidence intervals