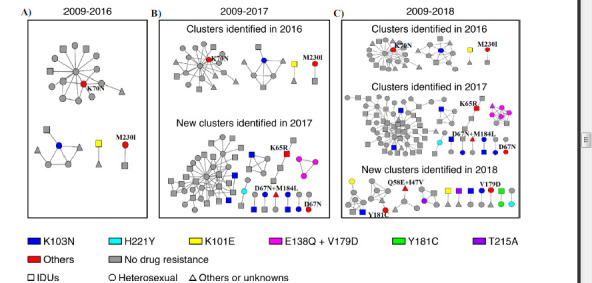
Fig. (2).

Growth of clusters with drug resistance mutations by the year of sampling. Three genetic transmission networks were constructed for HIV-infected people diagnosed from 2009-2016 (Fig. 2A), 2009-2017 (Fig. 2B) and 2009-2018 (Fig. 2C). Only transmission clusters containing drug resistance mutations are shown in the figures. Different colors represent different mutations, and red represents other mutations that appeared only once in the network; we labeled them beside the nodes in the figures. Circles represent heterosexual transmission, squares are IDUs and triangles are other methods or unknown. As shown in Fig. (2B), a cluster contained three nodes all carrying E138Q and V179D drug resistance mutations formed in 2017 and grew to contain 7 nodes (Fig. 2C); in 2018, five harbored the mutations, which are marked in pink.
