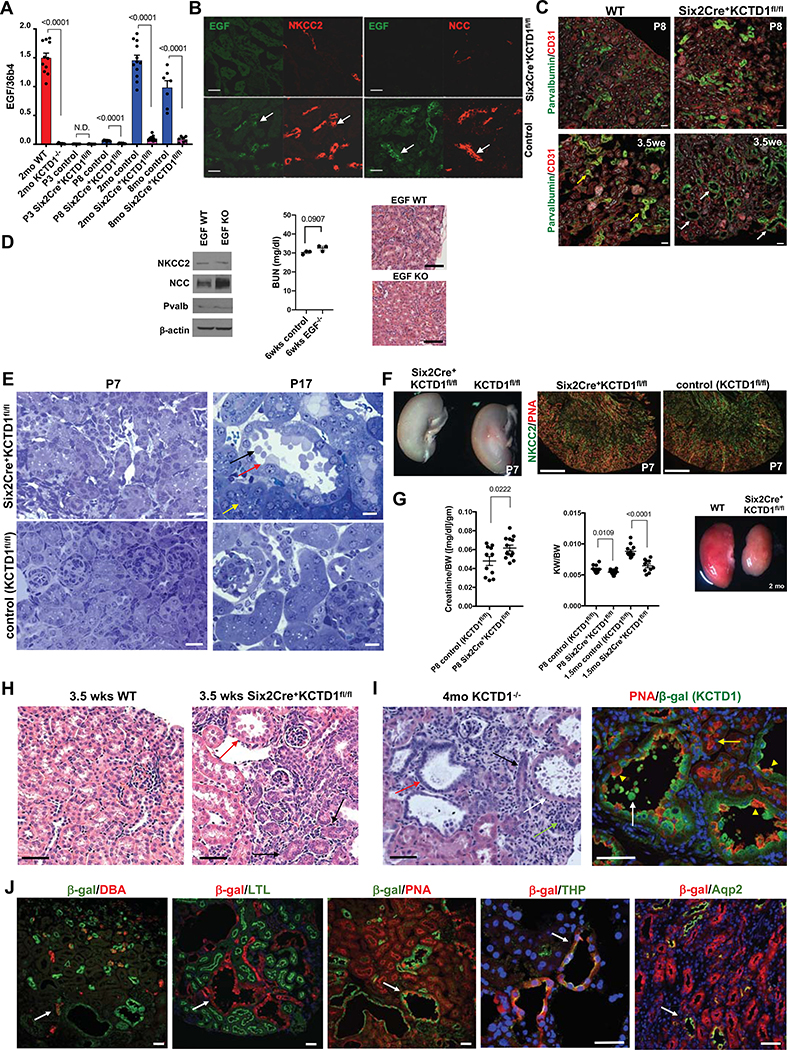
Figure 2: KCTD1 induces terminal differentiation of early-stage DCTs into mature DCTs.
A. Semiquantitative RT-PCRs of whole WT kidneys show that EGF expression is detected at P8 (ongoing terminal differentiation phase) but is absent at P3 (late nephrogenesis phase) and has high expression levels in the adult. In contrast, no EGF expression is detected at P8 in kidneys of Six2Cre+KCTD1fl/fl mice and is hardly detectable in adult kidneys of KCTD1−/− or Six2Cre+KCTD1fl/fl mice. N.D. = not detected.
B. Kidneys of 3.5-week-old Six2Cre+KCTD1fl/fl mice show no EGF and reduced immunolabeling for NCC and NKCC2 compared to WT control littermates in TALs/DCTs (EGF: green; NCC, NKCC2: red). Green and red channels of the same image are shown of co-immunolabeling for EGF and NKCC2 or NCC demonstrating that EGF expression normally occurs in either NCC+ DCTs or NKCC2+ TALs in WT kidneys (arrows). EGF is not detected in other nephron segments. Scale bars, 40 μm.
C. Dilated Pvalb+ DCT1s in 3.5-week-old Six2Cre+KCTD1fl/fl mice (white arrows) but not in WT littermates (yellow arrows), whereas DCT1s are not yet dilated in P8 Six2Cre+KCTD1fl/fl mice. Immunolabeling for the endothelial cell marker CD31 shows no major difference in kidney vascularization between Six2Cre+KCTD1fl/fl mice and littermate controls. Scale bars, 50 μm.
D. Young adult EGF KO mice do not phenocopy the kidney abnormalities seen in mice lacking KCTD1. Western blot of whole kidney lysates of 3-months-old EGF KOs versus control littermates shows normal NCC, Pvalb or NKCC2 protein levels. Six-week-old EGF KO mice show no increase in BUN levels and normal kidney histology. Scale bars, 100 μm.
E. Left: No tubule dilatation or blebbing are detected in the kidneys of P7 Six2Cre+KCTD1fl/fl mice (Toluidine blue staining of 1μm plastic sections). Scale bars, 20 μm. Right: At P17 distal tubules of Six2Cre+KCTD1fl/fl mice show dilatation and epithelial blebbing (black arrow) from apical sites of epithelial cells (red arrow). PTs appear normal (yellow arrow). Scale bars, 10 μm.
F. Kidneys of P7 Six2Cre+KCTD1fl/fl mice and littermate controls (KCTD1fl/fl mice) show no apparent anatomical or histological differences with formation of proper distal nephron segments (TAL marker NKCC2 in green; PNA, red). Scale bars, 500 μm.
G. Serum creatinine levels (normalized to BW) are increased in P8 Six2Cre+KCTD1fl/fl mice compared to littermate controls. KCTD1-deficient kidneys show a disproportionate postnatal growth retardation with a decreasing KW/BW ratio with age progression. Adult Six2Cre+KCTD1fl/fl mice have smaller kidneys than their WT littermates (2-months-old kidneys).
H. Kidneys of 3.5-week-old Six2Cre+KCTD1fl/fl mice show basophilic primitive distal nephron tubules (black arrows) in the renal cortex and dilated DCTs with epithelial blebbing (red arrow), which are not seen in kidneys of control littermates (WT). Scale bars, 20 μm.
I. Left: In 4-months-old KCTD1−/− mice dilated TALs/DCTs with epithelial blebs are seen (white arrow), while primitive basophilic tubules persist (black arrow), some showing dilatation (red arrow). A tubulointerstitial inflammatory infiltrate is seen (green arrow). Right: Lack of KCTD1 leads to dilated distal nephron epithelial tubules (PNA+, red epithelial cells; yellow arrowheads) that would normally express KCTD1 (β-gal+ in KCTD1−/− mice, green). Epithelial blebs are derived from distal nephron epithelium that lacks KCTD1 (show green color of β-gal+-derived cells) (white arrow). PTs show normal morphology (yellow arrow). Scale bars, 50 μm.
J. Labeling of KCTD1−/− mouse kidneys. Mice contain a lacZ cassette in the endogenous KCTD1 locus, so β-galactosidase activity represents cells that would normally express KCTD1, while antibodies or lectins label specific nephron segments. KCTD1 expression was observed in the TALs, DCTs, AQP2+ cells of the CTs and CDs, but not in the PTs, glomeruli or non-epithelial cells of the kidney.
DBA (dolichos biflorus agglutinin) lectin marks CTs/CDs (red, arrow). PNA (peanut agglutinin) lectin marks distal nephron epithelium (TALs, DCTs and CTs/CDs [red, arrow]; contiguous red labeling seen in PTs). LTL (lotus tetragonolobus) lectin marks PTs (green). Anti-Aqp2 immunolabeling marks Aqp2+ cells of CTs and CDs (green). Anti-Tamm-Horsefall protein (THP; green, arrow) immunolabeling marks the TAL. 9-months-old KCTD1−/− mice. Scale bars, 40 μm.
Graphs represent data as mean ± SEM. Semiquantitative RT-PCRs performed in triplicate with n>6 samples/group. P-values are shown (two-tailed, unpaired t-test).
See also Figures S1–S3.

