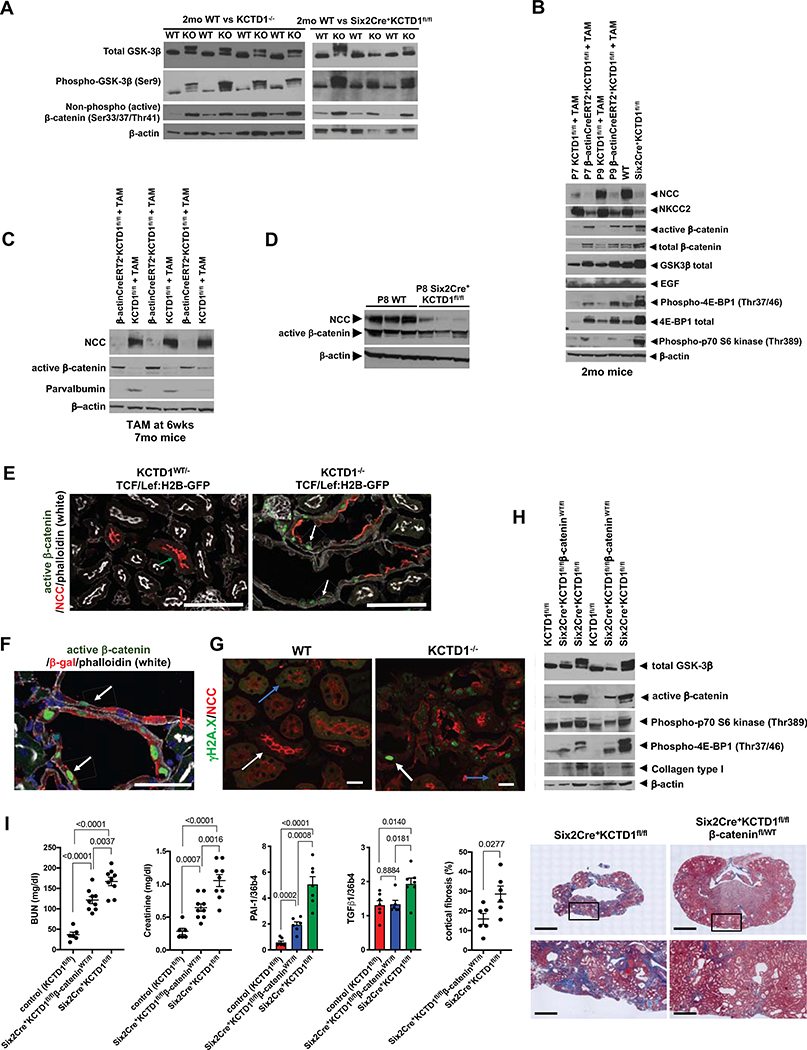
Figure 7: Lack of KCTD1 causes β-catenin hyperactivation that promotes renal fibrosis.
A. The increase in active β-catenin levels in kidneys of 2-month-old Six2Cre+KCTD1fl/fl mice or KCTD1−/− mice is associated with increased GSK-3β phosphorylation at Ser9 in the same kidneys, consistent with increased canonical Wnt/β-catenin signaling activity in kidneys due to KCTD1 deficiency.
B. Induced inactivation of KCTD1 (TAM-treated β-actinCreERT2+KCTD1fl/fl mice) at P7 or P9 (during the nephron terminal differentiation phase) leads to diminished protein levels of the DCT marker NCC, the TAL marker NKCC2 and of EGF (expressed in TALs and DCTs). Their decrease is associated with increased canonical Wnt/β-catenin signaling (increased GSK3β phosphorylation and increased total and active β-catenin), as well as increased p70 S6 kinase (Thr389) phosphorylation and 4E-BP1 (Thr37/46) phosphorylation when assessed at 2-months of age. These findings in kidneys of mice with induced inactivation of KCTD1 at P7 or P9 are similar to those of age-matched Six2Cre+KCTD1fl/fl mice. Kidney lysates of 2-months-old mice.
C. Induced inactivation of KCTD1 in 6-week-old mice and evaluation of their kidneys at 7-months of age shows that de-differentiation of DCTs in adult kidneys with loss of NCC and parvalbumin is associated with an increase in renal active β-catenin levels.
D. Kidneys of P8 Six2Cre+KCTD1fl/fl mice show loss of the DCT differentiation marker NCC whereas active β-catenin levels are not increased at that time.
E. Heterozygous KCTD1 mice show no high β-catenin signaling activity in their NCC+ DCTs (no TCF/Lef:H2B-GFP reporter activity in a 5-months-old KCTD1−/WTTCF/Lef:H2B-GFP mouse kidney; green arrow). In contrast, littermate KCTD1−/−TCF/Lef:H2B-GFP mice that lack KCTD1 in the distal nephron epithelium show GFP+ green nuclei (representing increased β-catenin signaling activity) in dilated DCTs (white arrows), often at sites with diminished NCC protein. Scale bars, 100 μm.
F. Strong β-catenin signaling activity (GFP+ green nuclei; arrows) is observed in β-gal+ (red) distal nephron epithelial cells that lack KCTD1 expression in adult KCTD1−/−TCF/Lef:H2B-GFP mice (β-gal+ cells are cells that would normally express KCTD1). Adjacent β-gal− PTs that do not normally express KCTD1 show no green nuclei (red arrow). 5-months-old KCTD1−/TCF/Lef:H2B-GFP reporter mouse is shown. Scale bar, 50 μm.
G. Increased staining for phospho-histone γH2A.X (Ser139) in NCC+ DCTs in 4-months-old KCTD1−/− mice (white arrow), whereas this staining is not observed in adjacent PTs that normally do not express KCTD1 (blue arrow). Staining for phospho-histone γH2A.X (Ser139) is also not observed in kidneys of WT littermates. Kidneys of a 4-months-old KCTD1−/− mouse and of a WT littermate are shown. Scale bar, 20 μm.
H. Kidneys of 8-months-old Six2Cre+KCTD1fl/flβ-cateninWT/fl mice have a lesser increase in active β-catenin levels (serving as a partial rescue of the increased β-catenin signaling activity due to KCTD1 deficiency) and less phospho-4E-BP1 (Thr37/46) and phospho-p70 S6 kinase (Thr389), as well as less type I collagen (a fibrosis marker), when compared to age-matched Six2Cre+KCTD1fl/fl mice.
I. Six2Cre+KCTD1fl/flβ-cateninWT/fl mice show an improved kidney function (reduced increases in BUN and creatinine serum levels) when compared to Six2Cre+KCTD1fl/fl mice. 8–9-months-old mice are shown. Renal fibrosis is strongly inhibited in kidneys of 8-months-old Six2Cre+KCTD1fl/flβ-cateninWT/fl mice compared to age-matched Six2Cre+KCTD1fl/fl mice. Renal transcript levels of PAI-1 and of TGF-β1, both associated with fibrosis, are strongly increased in Six2Cre+KCTD1fl/fl mice, whereas Six2Cre+KCTD1fl/flβ-cateninWT/fl mice have reduced renal PAI-1 and TGF-β1 levels when compared to those in Six2Cre+KCTD1fl/fl mice. Quantification of Trichrome-stained kidneys (fibrotic areas stain blue) of 8-months-old Six2Cre+KCTD1fl/flβ-cateninWT/fl mice and Six2Cre+KCTD1fl/fl mice shows that cortical fibrosis is strongly inhibited in Six2Cre+KCTD1fl/flβ-cateninWT/fl mice. Representative images of Trichrome-stained kidneys of 8-months-old Six2Cre+KCTD1fl/flβ-cateninWT/fl mice and Six2Cre+KCTD1fl/fl mice show that inhibition of β-catenin hyperactivation strongly reduces kidney fibrosis and cyst formation. Lower images are magnifications of the boxed cortical areas of the upper images. Scale bars: upper images 2 mm, lower images 100 μm.
Graphs represent data as mean ± SEM. Semiquantitative RT-PCRs performed in triplicate with n>6 samples/group. P-values are shown (two-tailed, unpaired t-test).

