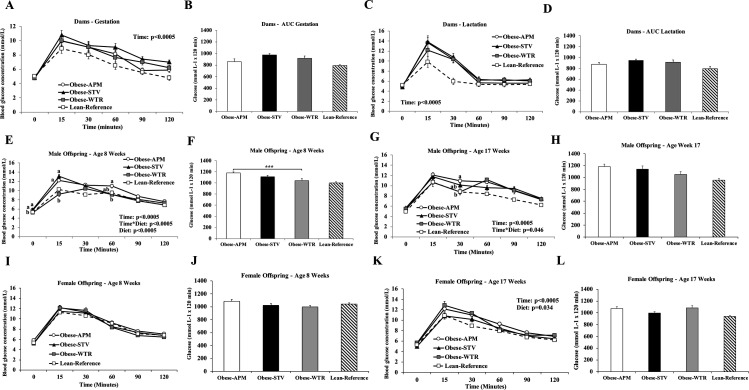
Figure 3.
Glucose tolerance of dams and offspring. (A) Dam glucose response during OGTT at gestation. (B) Dam AUC from gestation OGTT. (C) Dam glucose response during OGTT at lactation. (D) Dam AUC from lactation OGTT. (E) Male offspring glucose response during OGTT at age 8 weeks. (F) Male AUC from OGTT at age 8 weeks. (G) Male offspring glucose response during OGTT at age 17 weeks. (H) Male AUC from OGTT at age 17 weeks. (I) Female offspring glucose response during OGTT at age 8 weeks. (J) Female OGTT AUC at age 8 weeks. (K) Female offspring glucose response during OGTT at age 17 weeks. (L) Female AUC from OGTT at age 17 weeks. Values are mean±SEM. a, b superscripts indicate significant differences between groups where labelled means without a common superscript letter differ, p≤0.05. ***superscript indicates p<0.0005. Obese-APM, obese aspartame (n=10 dams gestation, n=9 dams lactation, n=9 M and 8 F offspring); obese-STV, obese stevia (n=8 dams gestation, n=7 dams lactation, n=7 M and F offspring); obese-WTR, obese control (n=13 dams gestation, n=6 dams lactation, n=6 M and F offspring); lean-reference, lean control (n=14 dams gestation, n=11 dams lactation, n=9 M and F offspring; not included in statistical analysis). AUC, area under the curve; OGTT, oral glucose tolerance tests.

