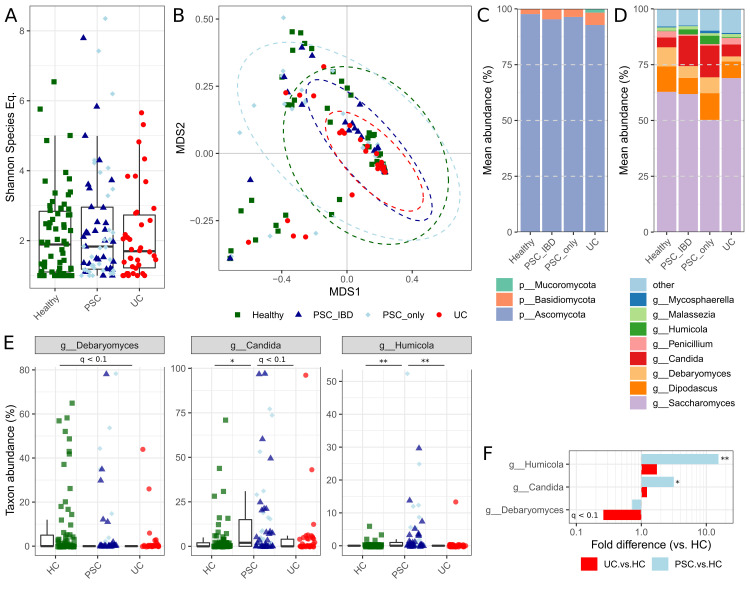
Figure 1.
Mycobiome of individuals with primary sclerosing cholangitis (PSC) and UC as well as healthy controls (HC) (all of northern German origin). Rarefaction curves for Shannon diversity of sequence variants reached plateau between 50 and 100 sequences per samples, thus samples were normalised to 100 random reads per sample. (A) Alpha diversity as presented by Shannon species equivalents (all p>0.05). (B) Beta diversity ordination of the Bray-Curtis dissimilarity based on genus-level fungal abundances (all padonis >0.05). (C) Phylum-level and (D) genus-level mean abundances of all taxa with >1% mean abundance and present in at least 10 samples. (E) Group-wise box-and-whisker plots for significant genus level annotations tested for differential abundances with individual values represented as data points. (F) Differences in group-mean abundances of patients with PSC and UC, as compared with HC. *q<0.05, **q<0.01.

