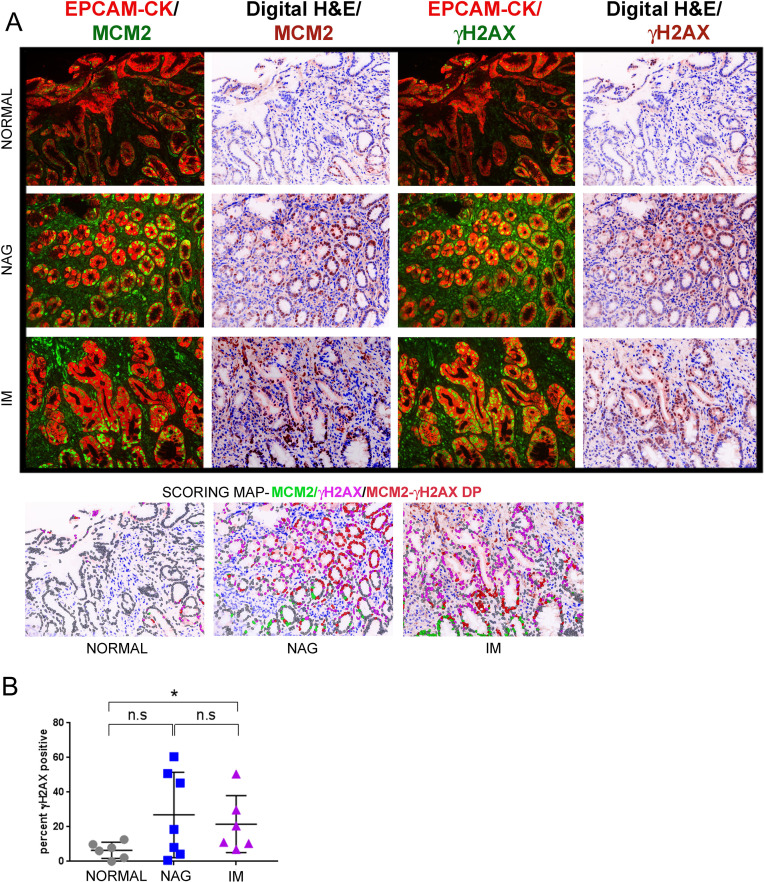
Figure 3.
γH2AX positivity increase in IM lesions as compared to normal controls in the GCEP cohort. (A) Samples from the GCEP cohort comprising of six cases of normal gastric tissue, seven cases of NAG and six cases of IM were subjected to multiplex IHC staining with antibodies against EpCAM/pan-Cytokeratin (CK), MCM2 and γH2AX. Immunofluorescence images of γH2AX or MCM2 with EpCAM/pan-Cytokeratin (CK) are shown. Scoring map depicts epithelial cells positive for γH2AX (magenta), MCM2 (green), γH2AX/MCM2 double-positive (DP) (red) and γH2AX/MCM2 double-negative (grey). (B) Plot shows percent γH2AX positivity across the three stages, normal, NAG and IM. Line within the vertical scatter plot shows the mean value. Error bar shows ±SD. Statistical significance was analysed by the Mann-Whitney non-parametric test. * p<0.05, n.s-not significant. GCEP, gastric cancer epidemiology programme; IHC, immunohistochemistry; IM, intestinal metaplasia; NAG, non-atrophic gastritis.

