Figure 5.
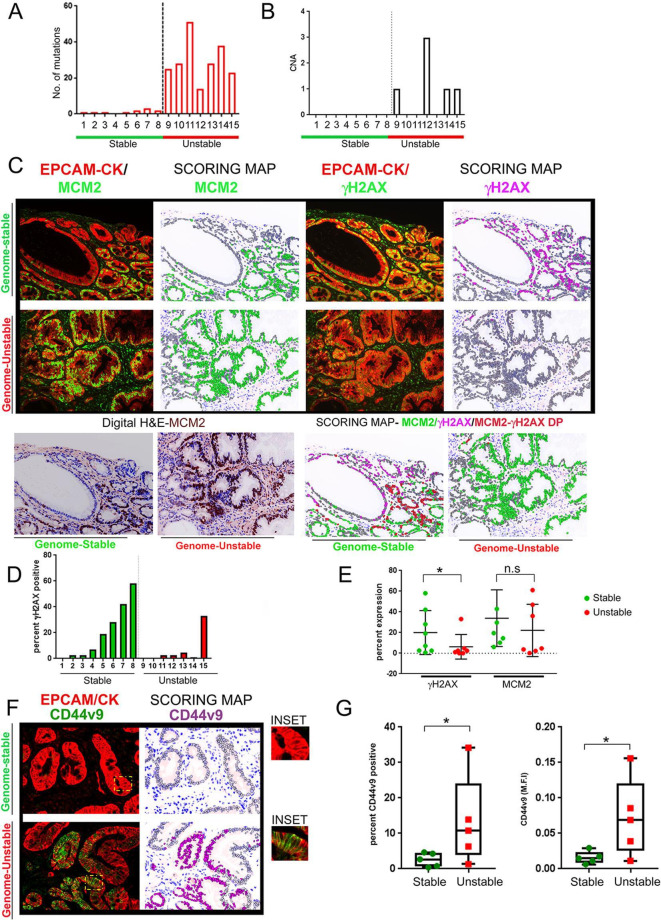
γH2AX positivity inversely correlates with mutational accumulation in IM samples. (A) IM samples were chosen from the GCEP cohort (n=15) and categorised either as genome-stable or genome-unstable, based on their mutational counts and CNAs. Mutational count of the 15 samples is shown. Genome-stable (n=8), genome-unstable (n=7). (B) CNAs for the 15 samples are shown. Genome-stable (n=8), genome-unstable (n=7). (C) IM tissues were subjected to multiplex IHC staining with antibodies against EpCAM/pan-Cytokeratin (CK), MCM2 and γH2AX. Regions with low epithelial content (<30%) or low IM coverage (<70%) were removed. (upper) Immunofluorescence images of MCM2 or γH2AX with EpCAM/pan-Cytokeratin (CK) are shown. (lower left) Digit H&E to show IM tissue architecture. (lower right) Scoring map depicts epithelial cells positive for γH2AX (magenta), MCM2 (green), γH2AX/MCM2 double-positive (red) and γH2AX/MCM2 double-negative (grey). (D) Graph shows percent γH2AX positivity across the IM samples. Bars in green and red represent the genome-stable and genome-unstable categories, respectively. (E) Plot shows percent γH2AX positivity and MCM2 in genome-stable and genome-unstable categories. (F) Immunofluorescence images of CD44v9 co-staining with EpCAM/pan-Cytokeratin (CK) are shown (left). Scoring map shows epithelial cells positive for CD44v9 (magenta coloured) or negative for CD44v9 (grey) (right). CD44v9 signals were either ‘dim’ or ‘bright’ within IM regions, and both types of signals were included for CD44v9 signal quantification. Areas marked by the yellow rectangle within the fluorescent images have been zoomed by two-fold under the images marked as ‘inset’. (G) Plots show CD44v9 percent positivity (left) and M.F.I (right) in the genome-stable and genome-unstable groups. Line within the vertical scatter plot shows the mean value. Error bar shows ±SD. Statistical significance was analysed by the Mann-Whitney non-parametric test. CNA, copy-number alteration; GCEP, gastric cancer epidemiology programme; IHC, immunohistochemistry; IM, intestinal metaplasia;M.F.I, mean fluorescence intensities.

