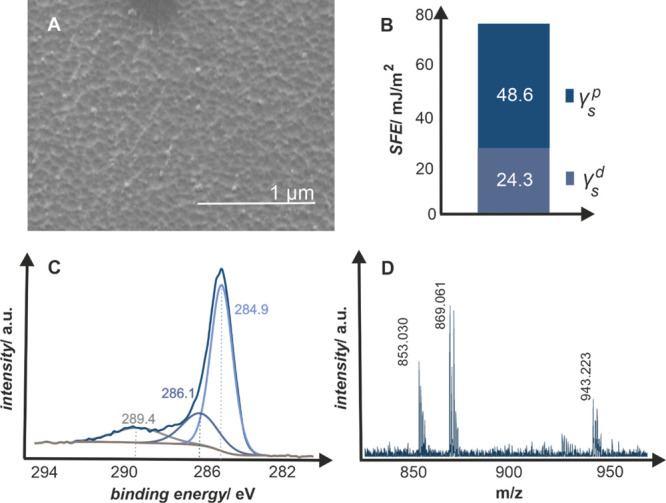
Figure 1.

Oxygen-plasma-modified parylene C surface: (A) SEM morphology, (B) polar and dispersive components of the SFE determined from the contact angle measurements, (C) C 1s XPS profile deconvoluted in characteristic binding energies for C–O and C=O groups at 286.1 and 289.4 eV, respectively, and (D) LDI-TOF mass spectrum with marked peaks for six parylene C repeating units alone (853.030 and 869.061 m/z) and with the attached −OH and −COOH chain ends (943.223 m/z).
