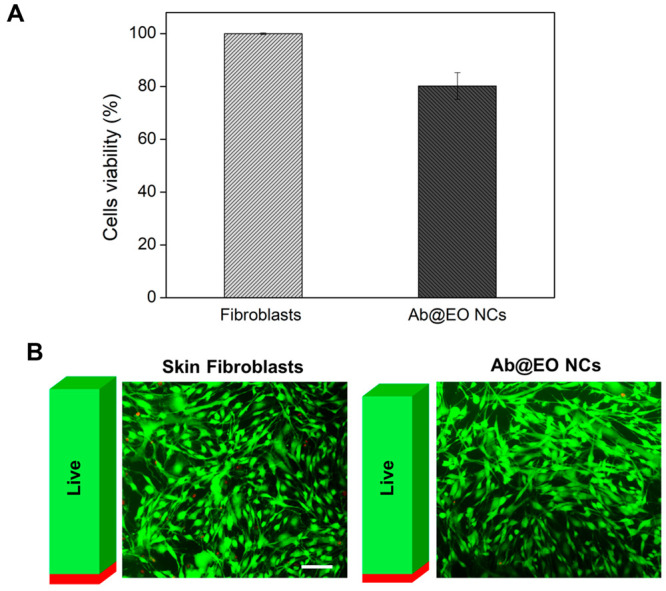
Figure 5.

Cytotoxicity of Ab@EO NCs. (A) Viability (%) of human fibroblasts exposed to Ab@EO NCs after 24 h of incubation, determined by AlamarBlue assay. (B) The Live/Dead assay of human fibroblasts after 24 h exposure to Ab@EO NCs. Overlapped images of live (green) and dead (red) cells. The bars aside each image represent the green and fluorescence intensities obtained after measuring at λex/em = 494/517 nm and λex/em = 528/617 nm for calcein and ethidium homodimer-1, respectively. Scale bar corresponds to 100 μm.
