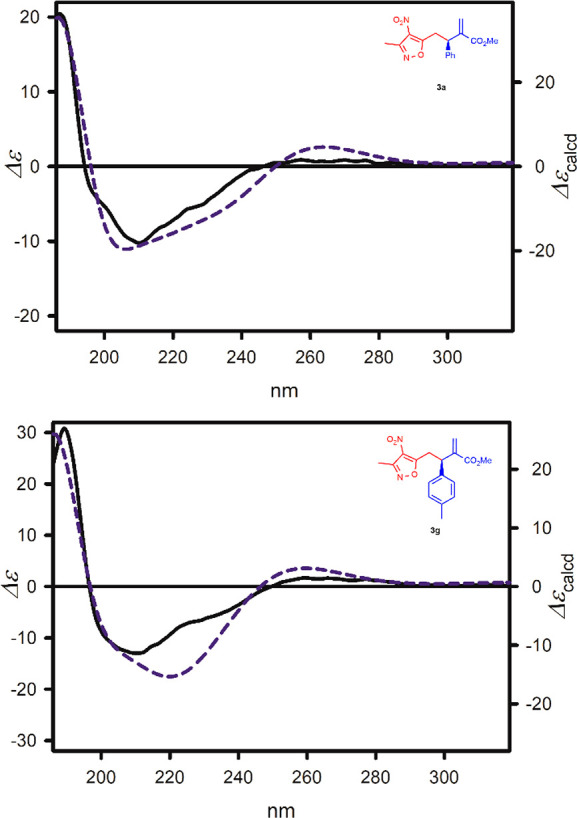
Figure 1.

ECD spectra of 3a and 3g, measured in cyclohexane (solid black lines) and calculated at the TD-CAM-B3LYP/6-311++G(2d,2p) level and ΔΔG-based Boltzmann average (dashed blue lines). Wavelengths were corrected to match the experimental UV maximum.
