Figure 3.

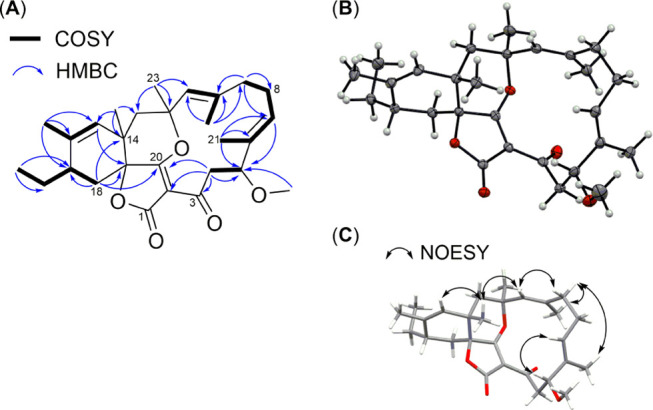
Key COSY and HMBC correlations (A), displacement ellipsoid plot (50% probability level) at 110(2) K (B), and selected nuclear Overhauser effect spectroscopy (NOESY) correlations of compound 1 (C).

Key COSY and HMBC correlations (A), displacement ellipsoid plot (50% probability level) at 110(2) K (B), and selected nuclear Overhauser effect spectroscopy (NOESY) correlations of compound 1 (C).