
Figure 6.
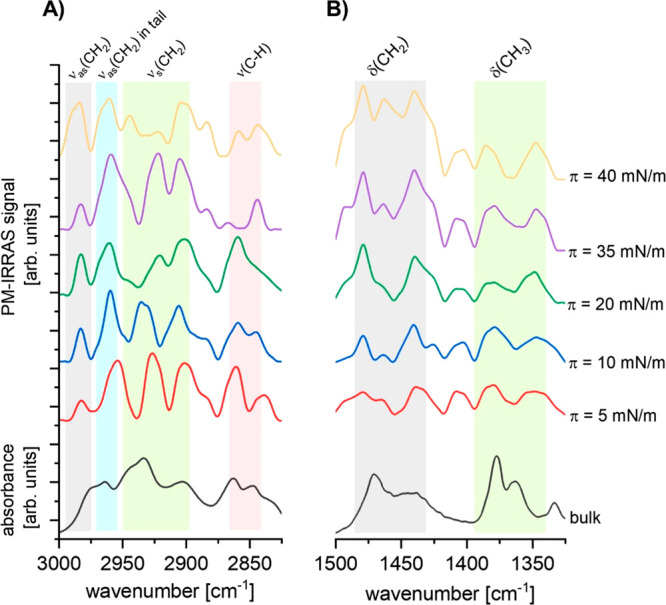
PM-IRRAS spectra for the 25-OH monolayer registered at 20 °C compared to the ATR-FTIR spectrum of 25-OH in bulk: hydrocarbon stretching vibrations region (A) and hydrocarbon scissoring vibrations region (B).
Official websites use .gov
A
.gov website belongs to an official
government organization in the United States.
Secure .gov websites use HTTPS
A lock (
) or https:// means you've safely
connected to the .gov website. Share sensitive
information only on official, secure websites.
PM-IRRAS spectra for the 25-OH monolayer registered at 20 °C compared to the ATR-FTIR spectrum of 25-OH in bulk: hydrocarbon stretching vibrations region (A) and hydrocarbon scissoring vibrations region (B).