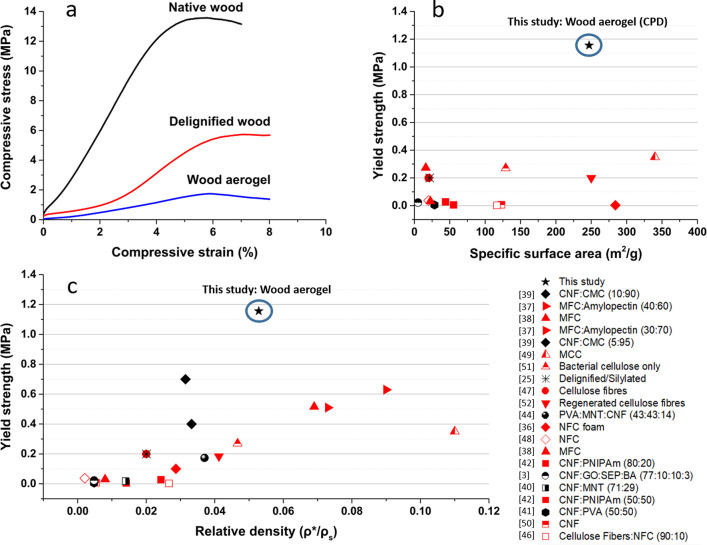
Figure 5.
(a) Compressive stress–strain curves of native wood, delignified wood, and wood aerogel, at 50% relative humidity and 23 °C. (b) Yield strength against the specific surface area for documented cellulose-based aerogels and foams. (c) Yield strength versus relative density for documented cellulose-based aerogels and foams, compared to this work.3,25,36−42,44,46−52 Black symbols represent aerogels and foams prepared to obtain anisotropy, whereas red symbols are aerogels and foams prepared with isotropic synthesis methods. ρ* represents the density of the individual porous material (kg/m3), and ρs represents the density of the solid cell wall material. Numbers in parentheses represent the wt % of the component. Relative densities used were either retrieved from the article or calculated, where the solid density 1500 kg/m3 was assumed for cellulose.34

