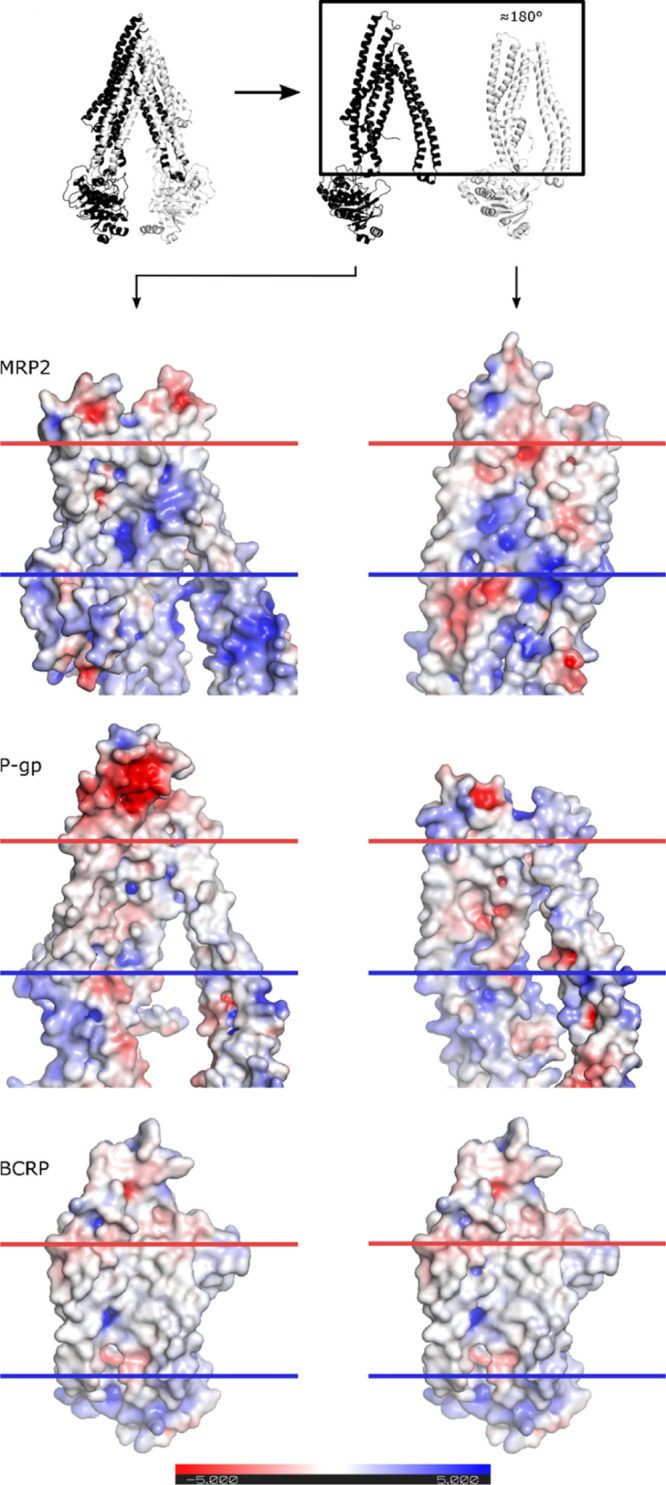
Figure 3.

Transporters were separated into halves and rotated to show the inner part, as depicted in the schematic. Electrostatic surfaces were calculated with APBS plugin in PyMOL version 2.1. The negatively and positively charged surfaces are illustrated by red and blue colors, respectively. The plasma membrane region is indicated with horizontal blue and red lines.
