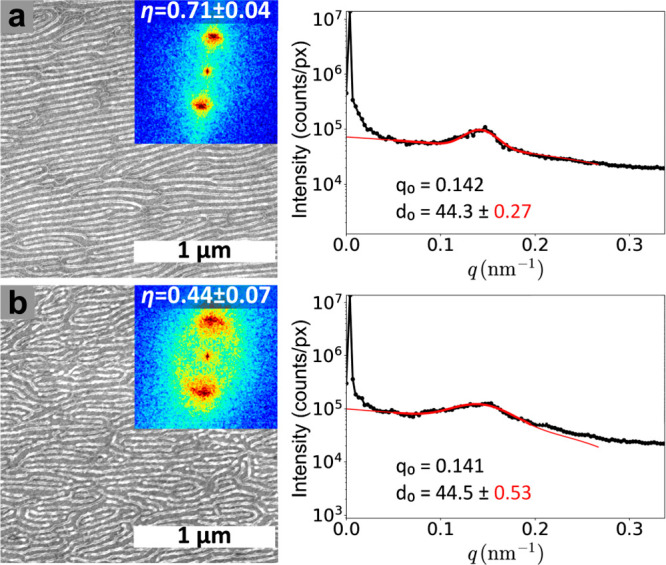
Figure 4.

SEM morphologies of C116 PS-b-P2VP after ordering at the maximum laser power (27 W) with corresponding FFT circular average plots. (a) After 8 cycles of laser passage at a base temperature of 60 °C and (b) displaying symptoms of thermal degradation after 32 cycles at 90 °C. Laser line velocity was 0.32 mm s–1. The images show a metalized (Pt) replica of the minority P2VP domains. The insets show FFTs with calculated orientational order parameter (η) values. In circularly averaged plots q0 indicates the primary peak position in the FFT and d0 is a corresponding real-space periodicity.
