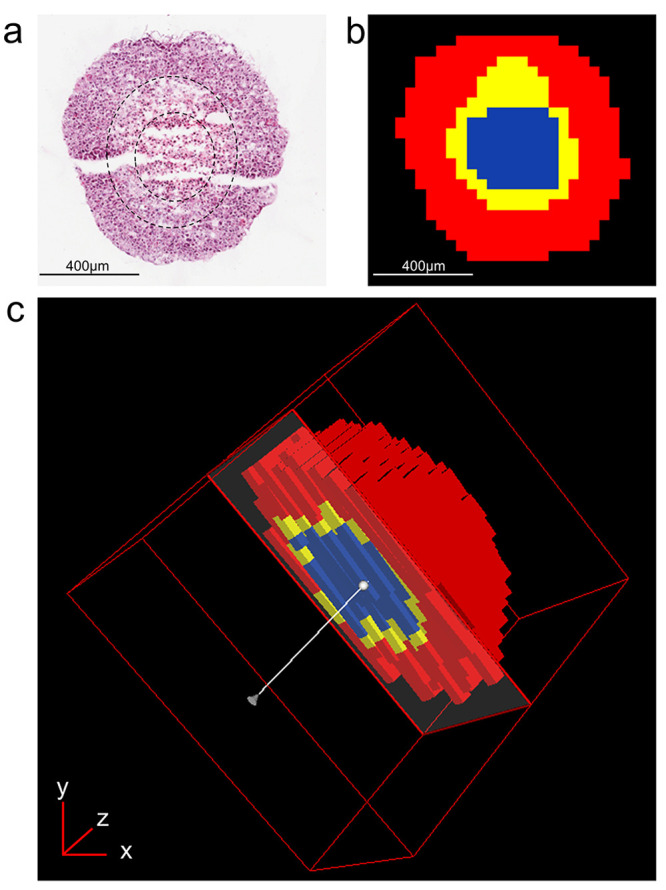
Figure 1.

Spatial segmentation of HCC827 aggregoid model from metabolite data by DESI-MSI. (a) H&E stain of central aggregoid section showing three separate regions within the tissue. Slight fissures can be observed in the tissue which formed during sectioning. Scale bar 400 μm. (b) Spatial segmentation of central aggregoid section identified three clustering regions that correspond to the hypoxia gradient: necrotic core (blue), annular quiescent region (yellow), and proliferative outer region (red). Scale bar 400 μm. (c) Realigned 3D construct of aggregoid displaying segmentation pattern throughout the model.
