
Figure 5.
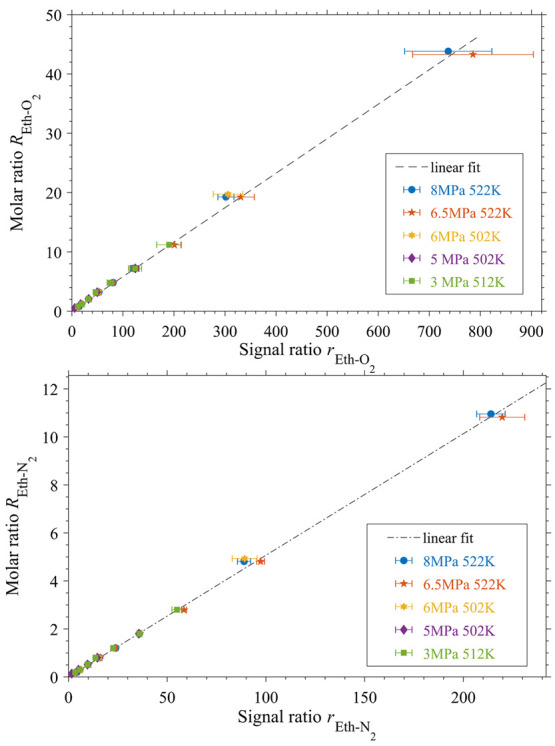
Calibration results for ethanol/oxygen and ethanol/nitrogen at different pressures and temperatures; linear fits of data given; (errorbars: standard deviation of 32 single spectra).
Official websites use .gov
A
.gov website belongs to an official
government organization in the United States.
Secure .gov websites use HTTPS
A lock (
) or https:// means you've safely
connected to the .gov website. Share sensitive
information only on official, secure websites.
Calibration results for ethanol/oxygen and ethanol/nitrogen at different pressures and temperatures; linear fits of data given; (errorbars: standard deviation of 32 single spectra).