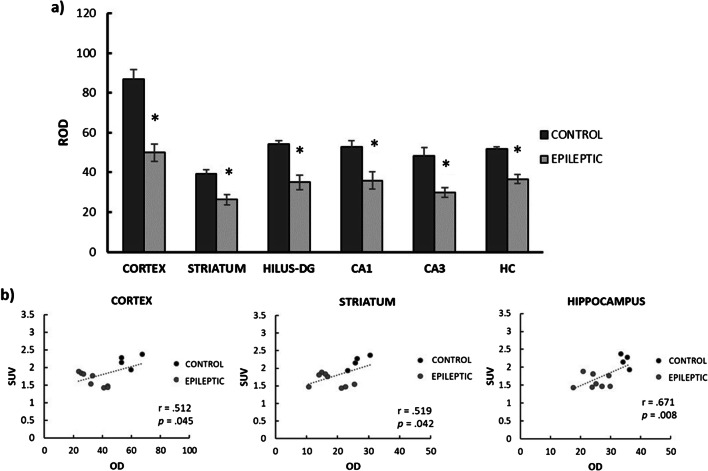
Fig. 6.
Immunofluorescence quantification of SV2A expression in different regions for control and epileptic groups. Bar plots (a) represent the mean ± SEM for control (n = 4) and epileptic groups (n = 9). Statistically significant differences in OD were found in all the regions (*p < 0.05). The scatter plots (b) illustrate regions with a significant correlation between the immunofluorescence (OD) and data obtained from [18F]UCB-H scanner (SUV). The dotted line represents the best fit for the data set. ROD = relative optical density; DG = dentate gyrus; CA = cornu ammonis; HC = hippocampus; OD = optical density.

