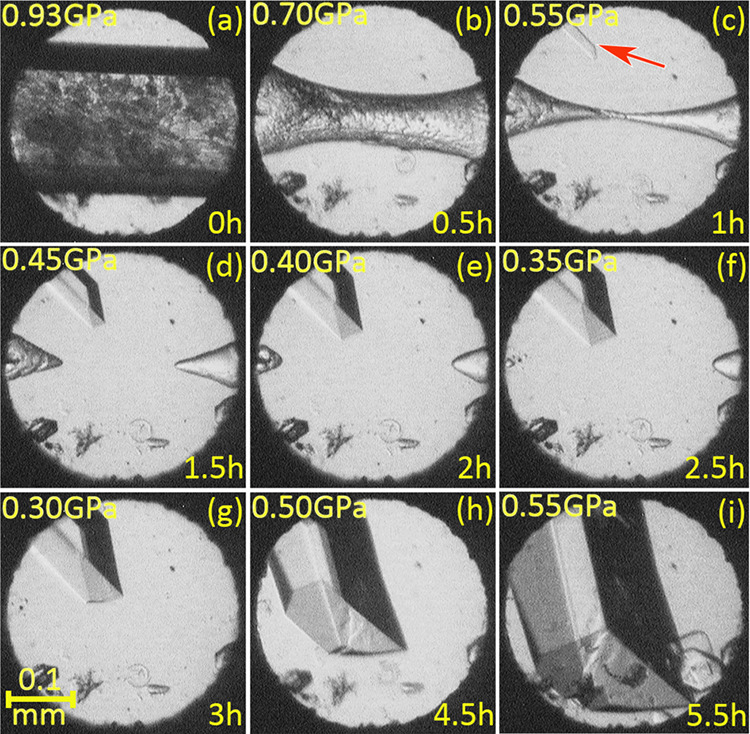
Figure 3.

A Res·H2O crystal (cf. Figure 2) covered by tiny 3Res·2H2O crystals at 296 K/0.93 GPa (a). After the pressure is released (b–d), dissolution concomitant with the single-crystal nucleation of 3Res·2H2O ((c), the seed indicated by the red arrow) and its further growth causes a further gradual reduction of pressure (e–g). Then (h, i), the pressure was increased to continue the growth. Several small ruby chips for the pressure calibration lie along the bottom edge of the DAC chamber.
