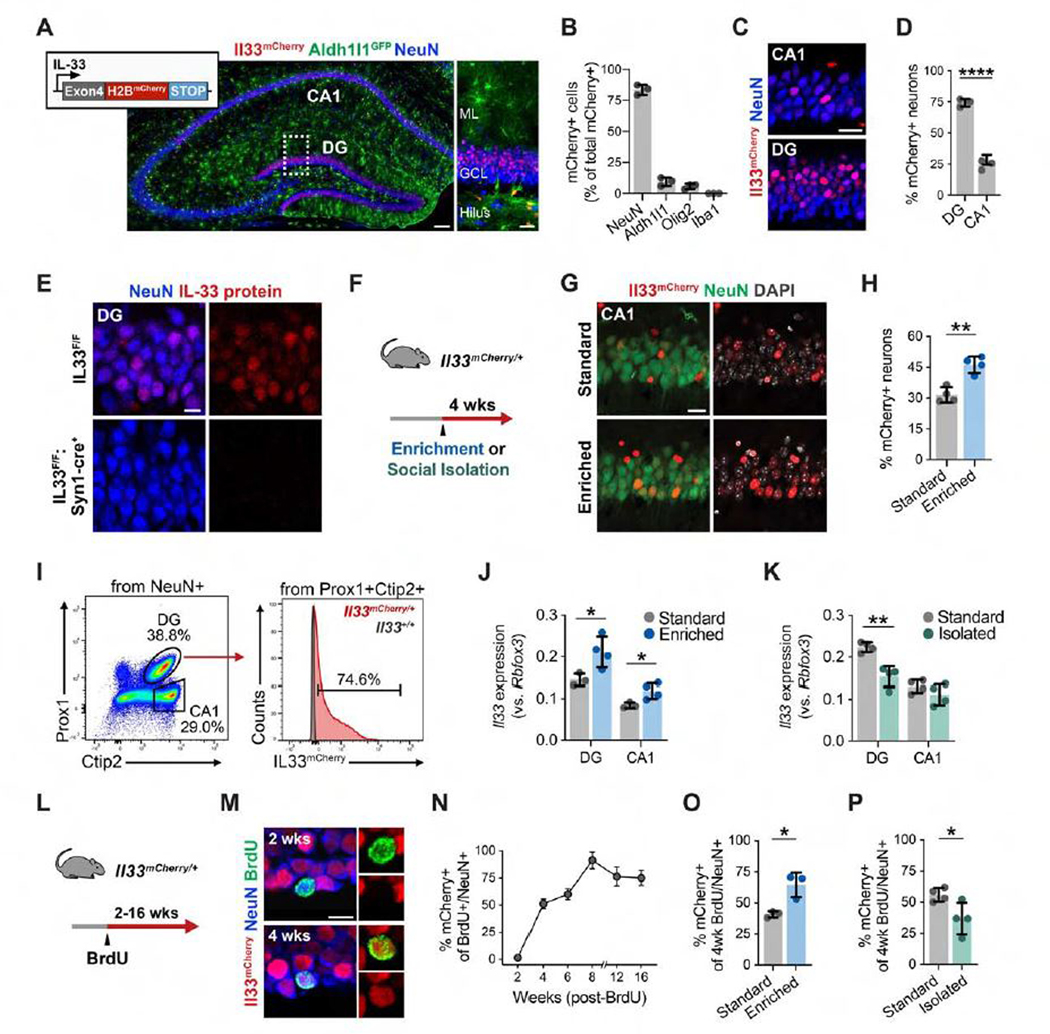
Figure 1. Experience-Dependent Regulation of IL-33 Expression in Adult Hippocampal Neurons.

(A and B) Post-natal day 30 (P30) hippocampus showing Il33mCherry, Aldh1l1eGFP (astrocytes), and NeuN (neurons). Inset, DG. Also shown is quantification of Il33-mCherry+ cells labeled with cell-type-specific markers. Scale bars, 100 μm and 20 μm (inset). ML, molecular layer; GCL, granule cell layer.
(C and D) Il33-mCherry+ neurons in the DG and CA1. Scale bar, 20 μm.
(E) IL-33 protein in DG neurons in the control (Il33fl/f) or after neuron-specific excision of Il33 (Il33fl/fl: Synapsin1-cre). Scale bar, 10 μm.
(F) Schematic of environmental enrichment (EE) and social isolation (SI).
(G and H) Image and quantification of the CA1 from Il33mCherry/+ mice under standard or EE conditions. Scale bar, 20 μm.
(I) Fluorescence-activated cell sorting (FACS) gating of Il33-mCherry+ neurons from the DG and CA1.
(J and K) Effect of an EE or SI on Il33 expression by qPCR.
(L) Schematic of newborn neuron labeling.
(M and N) Image and percentage of Il33-mCherry+ newborn neurons at the indicated time points after BrdU injection (n = 3 mice/time point; >20 neurons/mouse). Injected at 4 weeks of age. Scale bar, 10 μm.
(O) Effect of an EE on the percentage of Il33-mCherry+ newborn neurons; BrdU injection and EE at 12 weeks, analysis at 16 weeks.
(P) Effect of SI on the percentage of Il33-mCherry+ newborn neurons; BrdU injection and SI at 4 weeks, analysis at 8 weeks.
Statistics: two-tailed unpaired t tests. Dots represent individual mice. Data are mean ± SD. *p < 0.05, **p < 0.01, ***p < 0.001. See also Figure S1.
