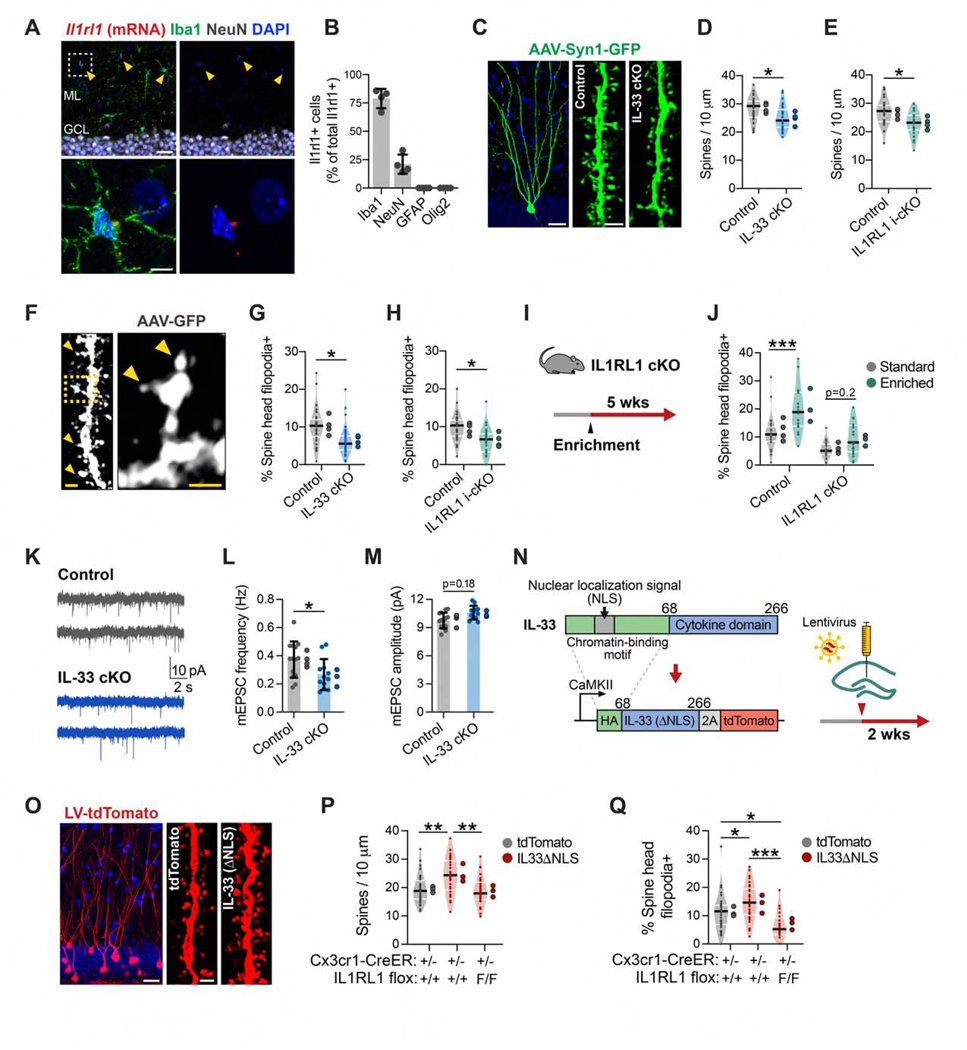
Figure 3. Neuron-Microglia Signaling via IL-33 Drives Experience-Dependent Spine Remodeling.
(A and B) ll1rl1 transcript co-labeled with antibodies to cell-type-specific markers in the DG (n = 4 mice). Scale bars, 25 μm and 5 μm (inset).
(C and D) Dendritic spine density in DG granule cells sparsely labeled with AAV9-Syn1-GFP in IL-33 cKO versus littermate controls (nested t test, n = 36 dendritic segments, 4 mice/genotype). Scale bars, 20 μm and 2 μm (spine inset).
(E) Spine density in IL1RL1 i-cKO versus littermate controls (nested t test, n = 27 dendritic segments, 4 mice/genotype).
(F-H) Percentage of spines with spine head filopodia in IL-33 cKO and IL1RL1 i-cKO versus littermate controls (arrowheads, spine head filopodia; statistics as in D and E). Scale bars, 1 μm and 0.5 μm (inset).
(I and J) Percentage of spines with spine head filopodia under standard or enriched conditions in IL1RL1 cKO mice versus littermate controls (2-way ANOVA, Tukey’s post hoc test, n = 18–24 dendritic segments, 3–4 mice/group).
(K-M) Frequency and amplitude of mEPSCs from IL-33 cKO mice and littermate controls (nested t test, n = 12–14 neurons, 3–4 mice/genotype).
(N) Schematic of IL-33ΔNLS viral gain-of-function strategy.
(O and P) Spine density after injection of control (tdTomato) or IL-33ΔNLSvirus into control orIL1RL1 i-cKO mice(one-way ANOVA, Tukey’s post hoc test, n = 29–33 dendritic segments, 3 mice/group). Scale bars, 20 μm and 1 μm (inset).
(Q) Percentage of spine head filopodia (sample sizes and statistics as in P).
*p < 0.05, **p < 0.01, ***p < 0.001. Data are mean ± SD (bar graphs) and median ± interquartile range (violin plots). Larger dots to the right of each plot indicate mean per individual mouse. See also Figure S3 and Table S2.

