
Figure 7. IL-33 Deficiency Leads to Accumulation of Perisynaptic ECM.
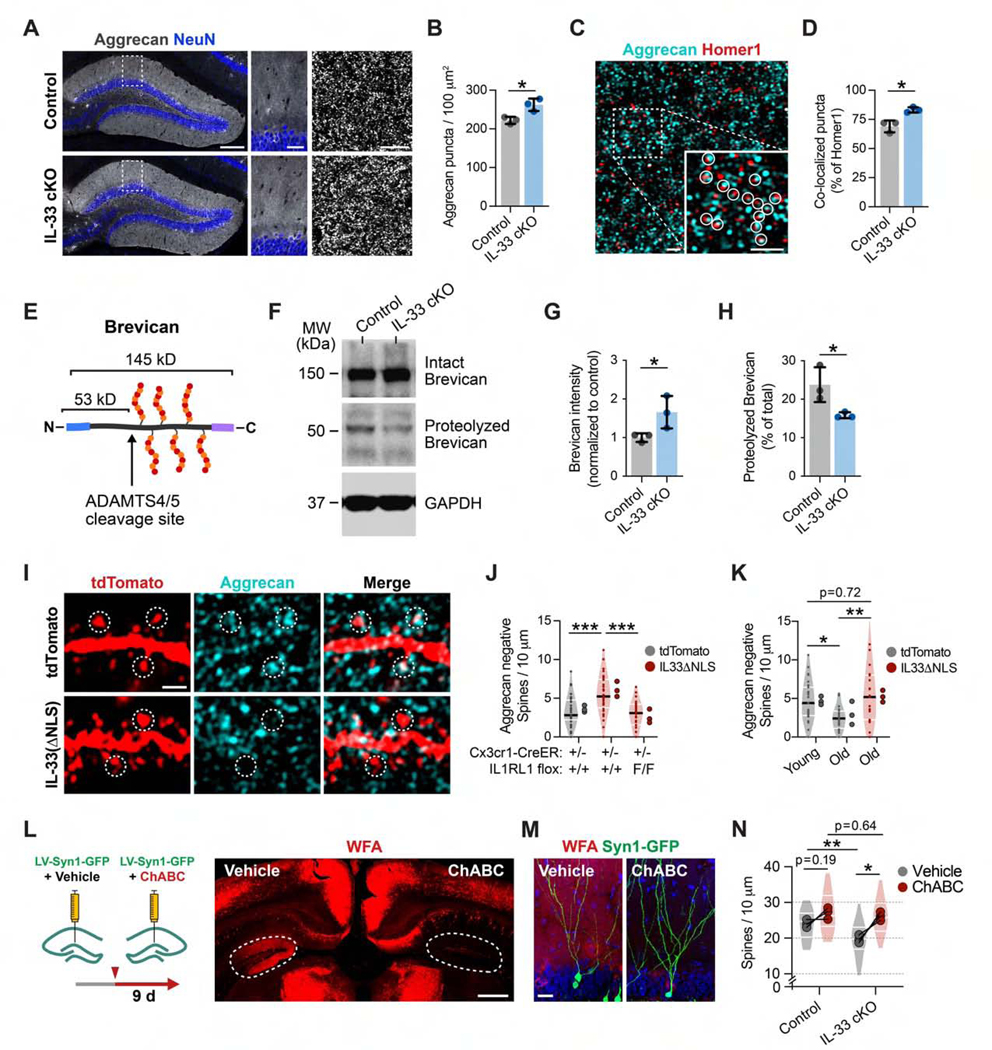
(A and B) Quantification of Aggrecan punctum density in control and IL-33 cKO mice. Insets, DG ML (t test, n = 3 mice/genotype). Scale bars, 200 μm (left), 40 μm (center), 5 μm (right).
(C and D) Aggrecan and Homerl immunostaining and co-localization in the ML (circles, co-localized puncta; t test, n = 3 mice/genotype). Scale bars, 1 μm and 1 μm (inset).
(E) Brevican CSPG and proteolytic cleavage site.
(F-H) Western blot of Brevican from hippocampal lysate in IL-33 cKO and littermate controls, including uncleaved (145 kD, G) and cleaved (53 kD, H) forms (t test, n = 3 mice/genotype).
(I and J) Aggrecan co-localization with dendritic spines in the DG injected with control (tdTomato) orIL-33 gain-of-function (IL-33ΔNLS) virus in control or IL1RL1 i-cKO mice (one-way ANOVA, Tukey’s post hoc test, n = 29–33 dendritic segments, 3 mice/group). Scale bar, 1 μm.
(K) Aggrecan co-localization with spines in young and old mice injected with a control or IL-33ΔNLS virus (one-way ANOVA, Tukey’s post hoc test, n = 19–27 dendritic segments, 3 mice/group).
(L and M) Schematic and representative images of ChABC digestion imaged with Wisteria floribunda agglutinin (WFA) staining (dashed circles, DG). Scale bars, 500 μm (L) and 20 μm (M).
(N) Dendritic spine density in IL-33 cKO or control mice injected with ChABC or vehicle (2-way RM ANOVA, Sidak’s post hoc test, n = 3 mice/genotype; dots, means per mouse; lines connect vehicle- and ChABC-injected hemispheres; violin plots show distribution of dendritic segments per group, 23–30 segments).
*p < 0.05, **p < 0.01, ***p < 0.001. Data are mean ± SD (bar graphs) and median ± interquartile range (violin plots). Larger dots to the right of violin plots indicate means per mouse.