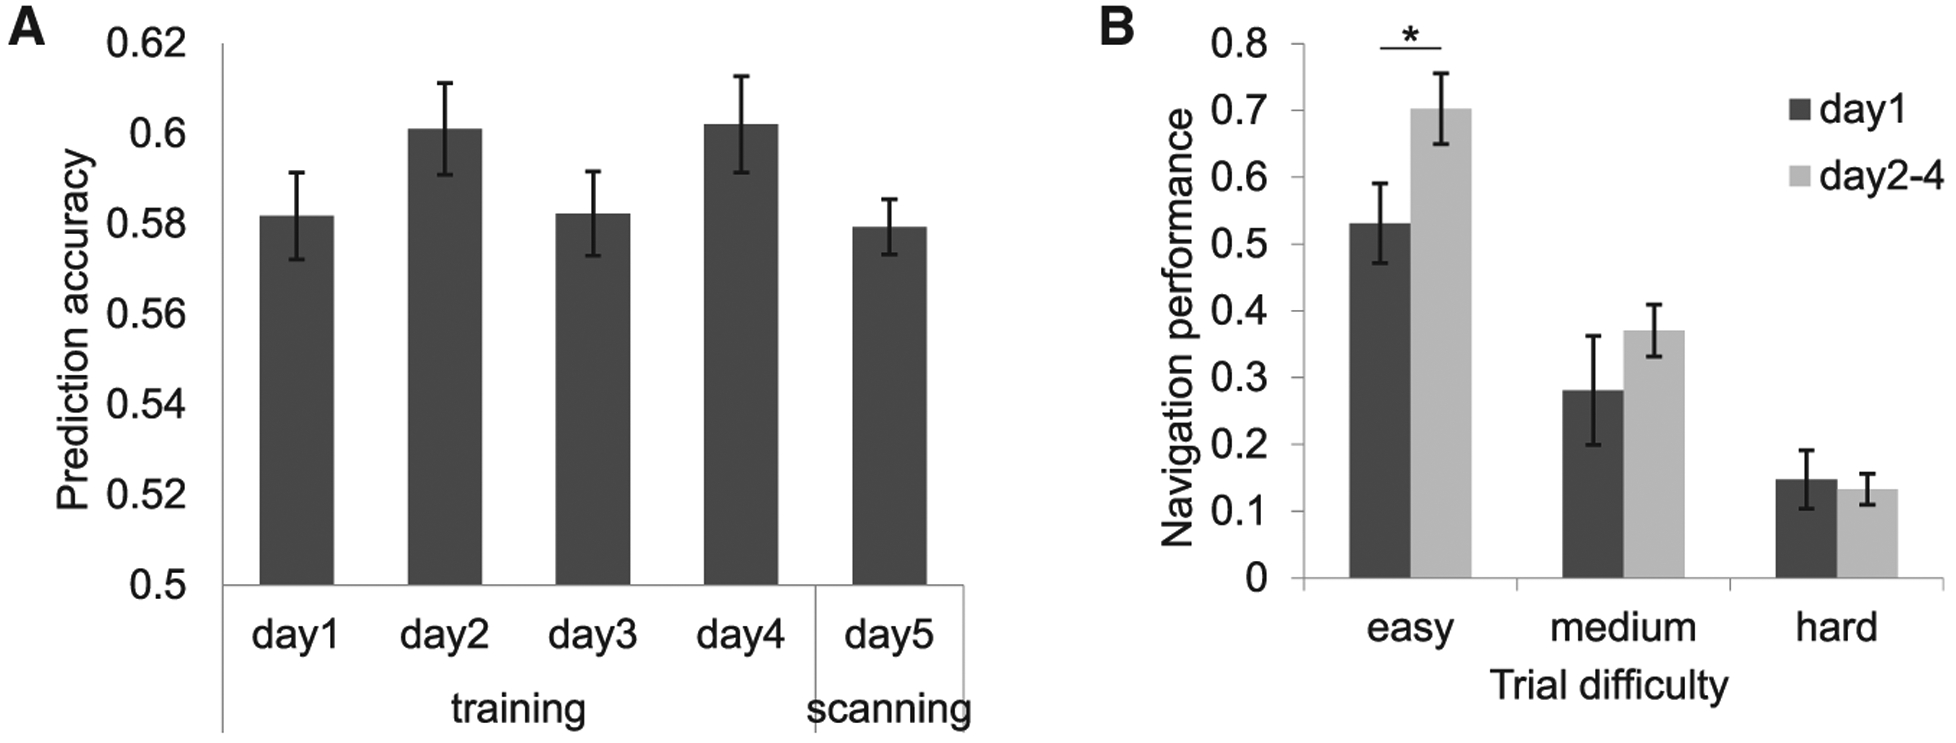
Figure 2. Olfactory Navigation Performance.

(A) Performance accuracy during φ training days and the following scanning day were consistently and significantly greater than chance (50%; Z > 4.21; p < 0.001; Wilcoxon signed-rank test).
(B) Navigation performance (computed as the prediction d’ adjusted for perceptual discrimination on a subject-wise basis) revealed a significant effect of training, particularly for easy trials (day 1 versus days 2–4; easy trials: t24 = −2.17, *p = 0.04; medium trials: t24 = −1.01, p = 0.32; hard trials: t24 = 0.28, p = 0.78; paired t tests; two-tailed). In this and all figures, statistical tests are one-tailed unless otherwise noted; error bars, ±1 SEM.
