
Figure 2.
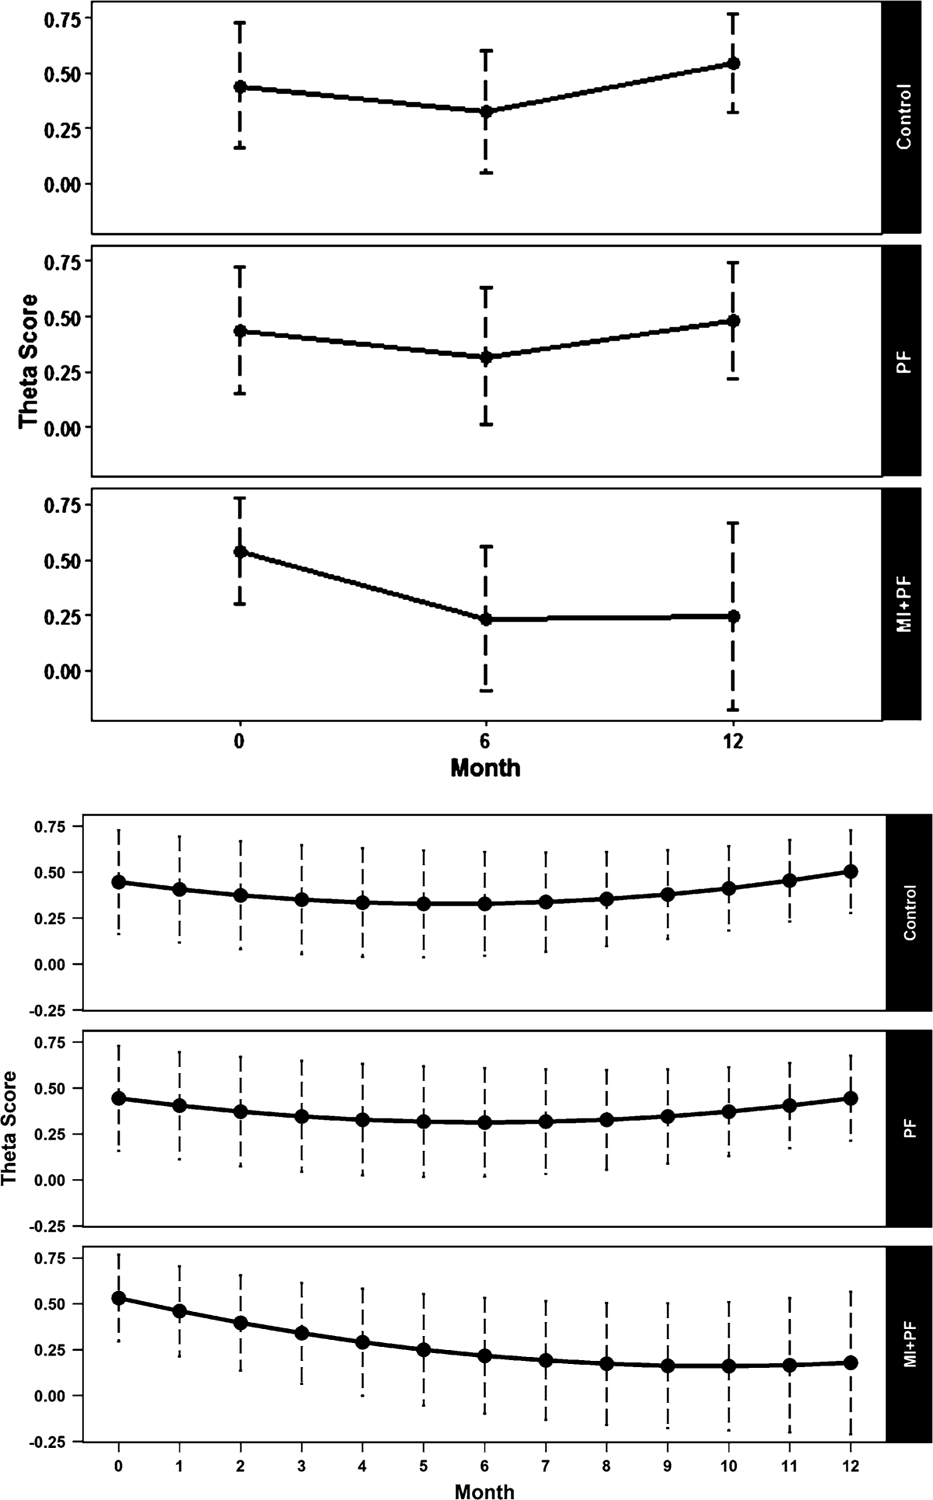
Model-based mean estimates for three different groups using the estimated full model shown in Table 5. The top figure shows estimates at baseline, and 6- and 12-month follow-ups. The bottom figure shows monthly estimates for 12 months post intervention. Theta score = latent trait severity score for alcohol-related problems. PF = stand-alone personalized feedback intervention; MI + PF = in-person motivational intervention with personalized normative feedback profile. Values for covariates were set for White, first-year, male students with a mean PBS score at baseline. Vertical dotted lines indicate 95% confidence intervals.