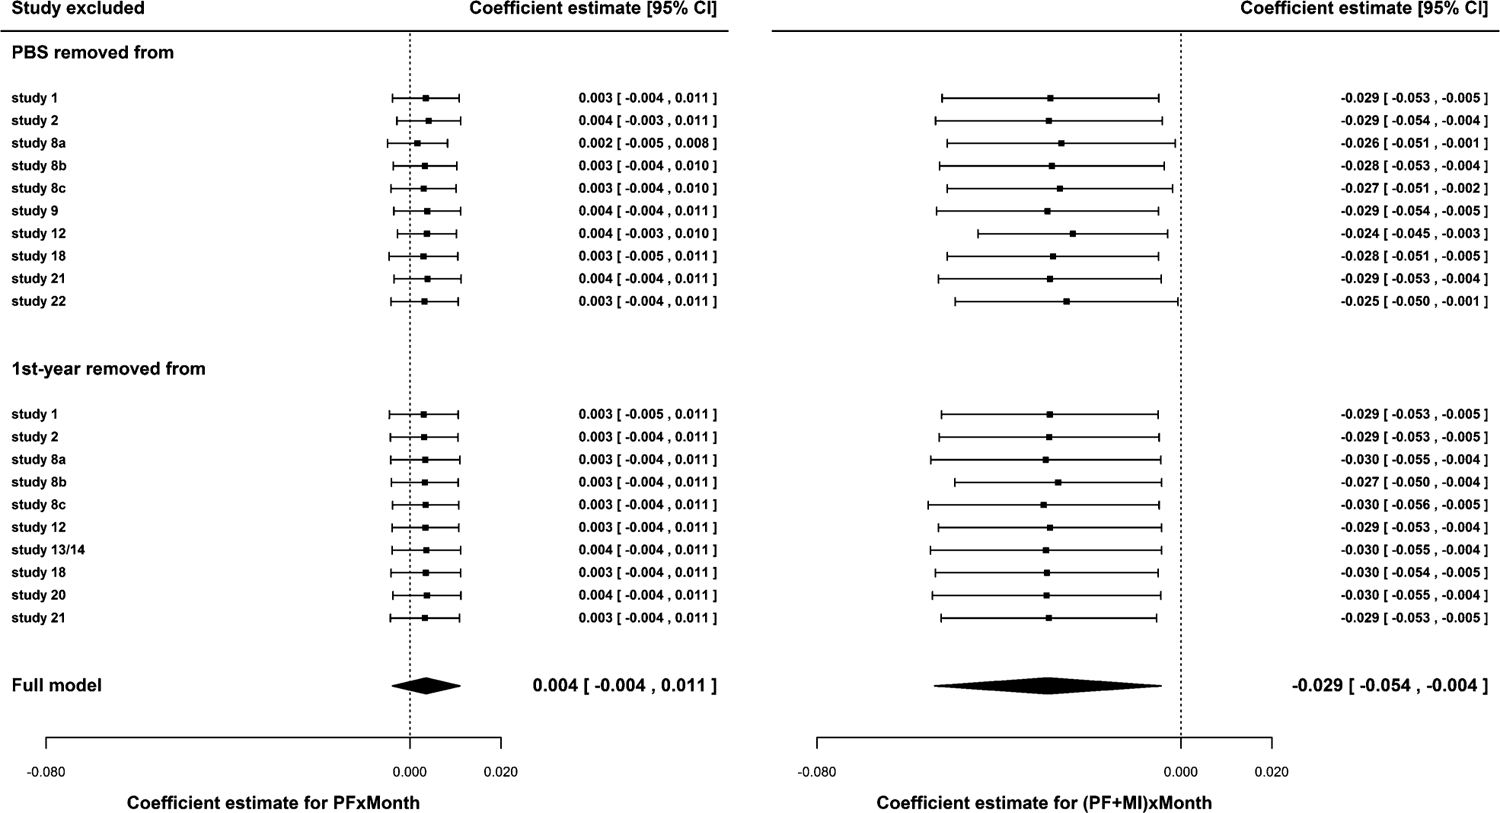
Figure 4.

Results from sensitivity analyses where each covariate from each study was treated as systematically missing in the second step. The effects of the exclusion of a continuous covariate (PBS at baseline; top) and a binary covariate (first-year student status; bottom) on the combined estimates of PF × Linear Slope (left) and (MI + PF) × Linear Slope (right) are shown, respectively. Filled diamond symbols indicate the combined estimates from all 14 studies as reported in Table 5. The estimates from sensitivity analyses are shown in filled squares.
