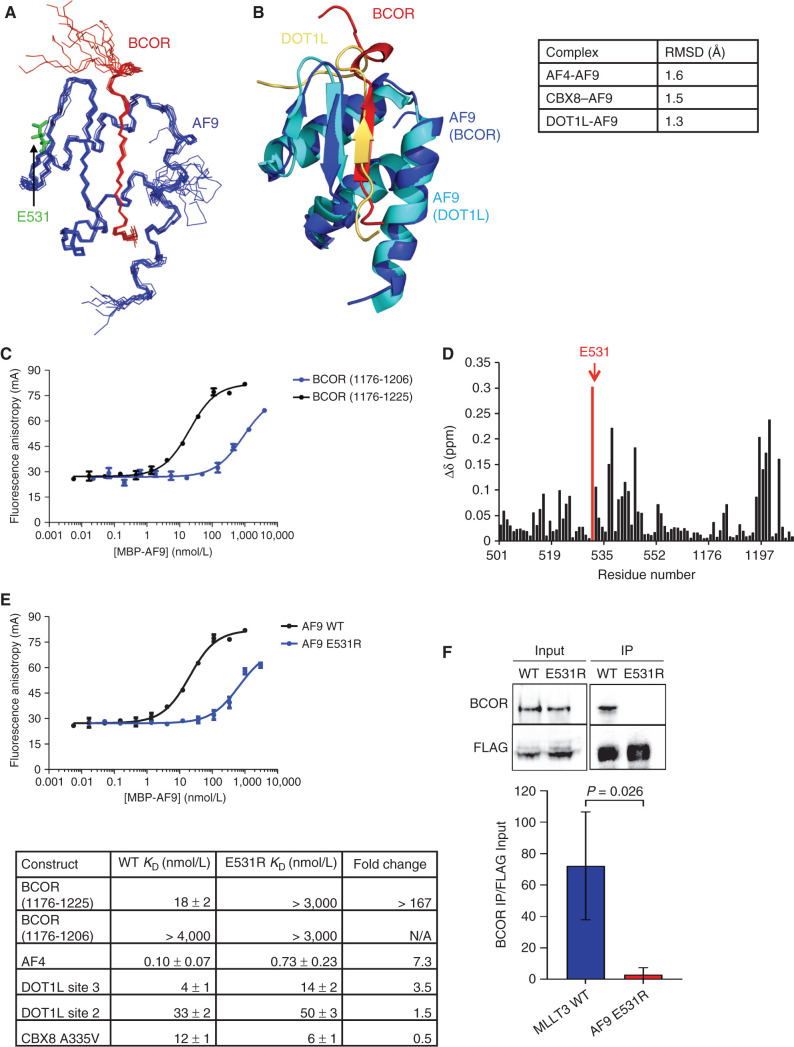
Figure 3.
Structure and binding properties of the BCOR–AF9 AHD complex. A, Ensemble of the 10 lowest energy conformers from the structure calculations, with BCOR in red and AF9 in blue. Unstructured BCOR residues 1176–1191 have been omitted for clarity. B, Alignment of the BCOR–AF9 and DOT1L–AF9 structures, with BCOR in red and its AF9 in blue, and DOT1L in gold and its AF9 in cyan. Backbone RMSD for AF9 residues 502–562 between BCOR–AF9 and the other AF9 complexes is shown in the table on the right. Unstructured BCOR residues 1176–1191 and DOT1L residues 893–900 have been omitted for clarity. See also Supplementary Table S2 and Supplementary Fig. S1. C, Results of FA assays for binding of MBP-AF9 to fluorescein-labeled BCOR (1176–1206) (blue) and BCOR (1176–1225) (black) peptides. Error bars, SEM for three replicates. D, Weighted chemical shift difference for AF9 residues in 15N-1H HSQC spectra of BCOR (1176–1228)–AF9 versus BCOR (1175–1207)–AF9 complexes calculated using |Δδ15N|/4.69 + |Δδ1HN|. AF9 E531 is shown in red. E, Top, results of FA assays for binding of MBP-AF9 E531R (blue) and MBP-AF9 (black) to a fluorescein-labeled BCOR (1176–1225) peptide. Error bars, SEM for three replicates. Bottom, effect of the AF9 E531R mutation on the binding of fluoresceinated peptides of all binding partners measured by FA. Fold change is calculated as E531R KD/WT KD. See also Supplementary Fig. S2. F, Immunoprecipitation (IP) of endogenous BCOR with FLAG-tagged AF9 or AF9 E531R from HEK293T cells. One representative immunoblot and summary from three independent experiments quantified relative to input MLLT3 levels.

