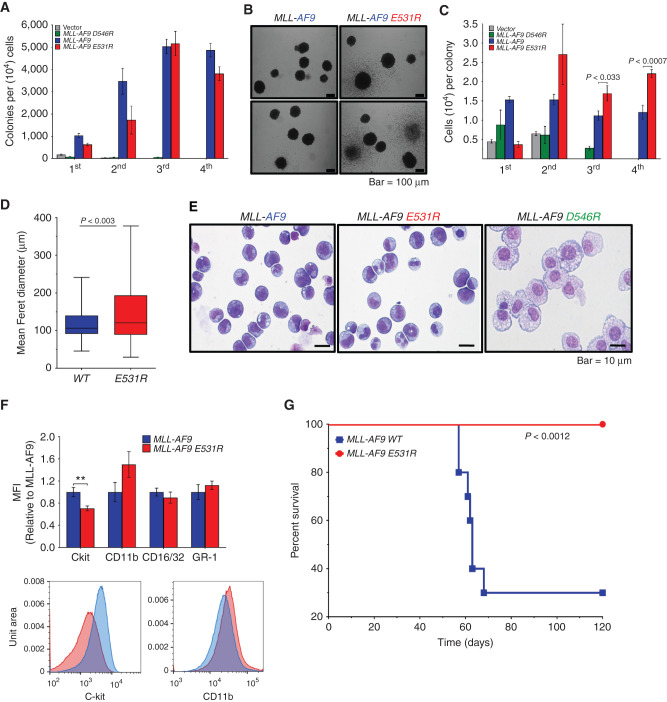
Figure 4.
MLL-AF9 E531R shows increased cell proliferation and prevents leukemogenesis in vivo. A, Quantification of methylcellulose colony formation from serial replating of MLL-AF9– and MLL-AF9 E531R– or D546R–transduced mouse BM cells. Data are from six experiments, each in triplicate, and are represented as mean ± SEM. B, Bright-field images of MLL-AF9 WT and E531R colonies. C, Quantification of cells per colony formed from serial replating of transduced mouse BM cells as in A. Data are from six experiments, each in triplicate, and are represented as mean ± SEM. Statistical significance was determined using a Student two-tailed t test with a confidence interval of 95%. D, Feret diameter box plots for MLL-AF9 WT (n = 115) and MLL-AF9 E531R (n = 88) colonies. Box indicates 1st and 3rd quartiles, line indicates median, and whiskers represent max and min. Statistical significance was determined using a Student two-tailed t test with a confidence interval of 95%. E, Images of Wright–Giemsa-stained MLL-AF9–, MLL-AF9 E531R–, and MLL-AF9 D546R–expressing mouse BM cells following the third plating in methylcellulose (scale bar, 10 μm). F, Summary of immunofluorescence staining and one representative flow cytometry plot of MLL-AF9 and MLL-AF9 E531R cells from E for hematopoietic stem and differentiation surface markers. Relative mean fluorescence intensity (MFI) of staining is shown. Data are from five independent experiments; **, P < 0.01. G, Survival curves for sublethally irradiated mouse recipients (n = 10 for each cohort) of BM cells transformed with MLL-AF9 WT (blue) or MLL-AF9 E531R (red). Statistical significance was determined using a log-rank (Mantel–Cox) test. For details, see also Supplementary Fig. S3.

