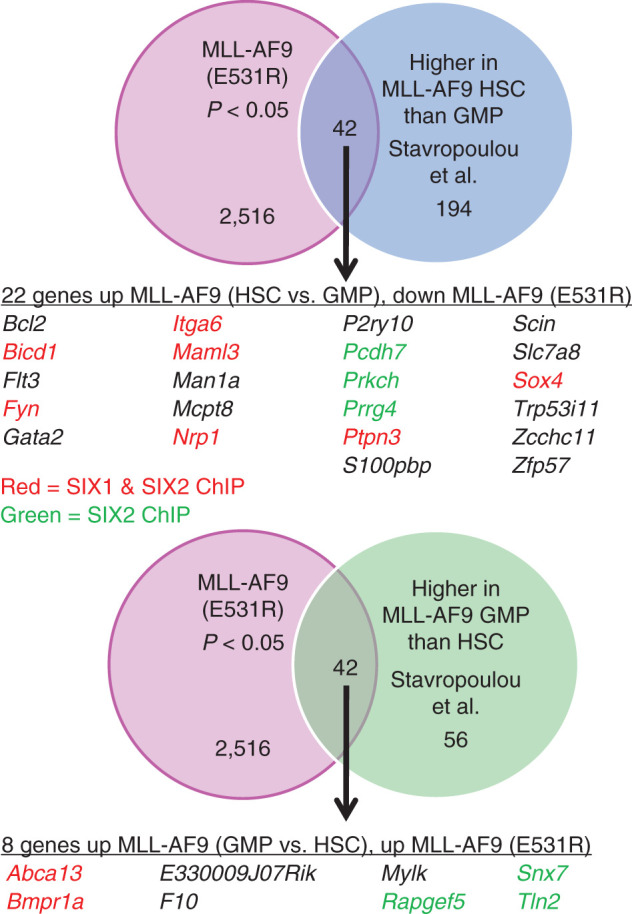
Figure 6.

Comparison of MLL-AF9 E531R (disruption of BCOR binding) RNA-seq data to RNA-seq data from Stavropolou and colleagues (35), identifying genes with increased expression in MLL-AF9 HSCs versus MLL-AF9 GMPs. Top, Venn diagram showing overlap of genes altered in the MLL-AF9 E531R gene set and increased in MLL-AF9–expressing HSCs versus MLL-AF9–expressing GMPs. The table lists all the genes in the overlap set that are increased in MLL-AF9 HSCs versus GMPs and that are down in the MLL-AF9 E531R gene set. The genes in the table that have been shown by ChIP-seq to be either SIX1 and SIX2 targets or solely SIX2 targets are colored in red and green, respectively. Bottom, Venn diagram showing overlap of genes altered in the MLL-AF9 E531R gene set and increased in MLL-AF9–expressing GMPs versus MLL-AF9–expressing HSCs. The table lists all the genes in the overlap set that are increased in MLL-AF9 GMPs versus HSCs and increased in the MLL-AF9 E531R gene set. The genes in the table are colored as above.
